Search Results for: hdr
Vahan Sosoyan MakeHDR – an OpenFX open source plug-in for merging multiple LDR images into a single HDRI
https://github.com/Sosoyan/make-hdr
Feature notes
- Merge up to 16 inputs with 8, 10 or 12 bit depth processing
- User friendly logarithmic Tone Mapping controls within the tool
- Advanced controls such as Sampling rate and Smoothness
Available at cross platform on Linux, MacOS and Windows Works consistent in compositing applications like Nuke, Fusion, Natron.
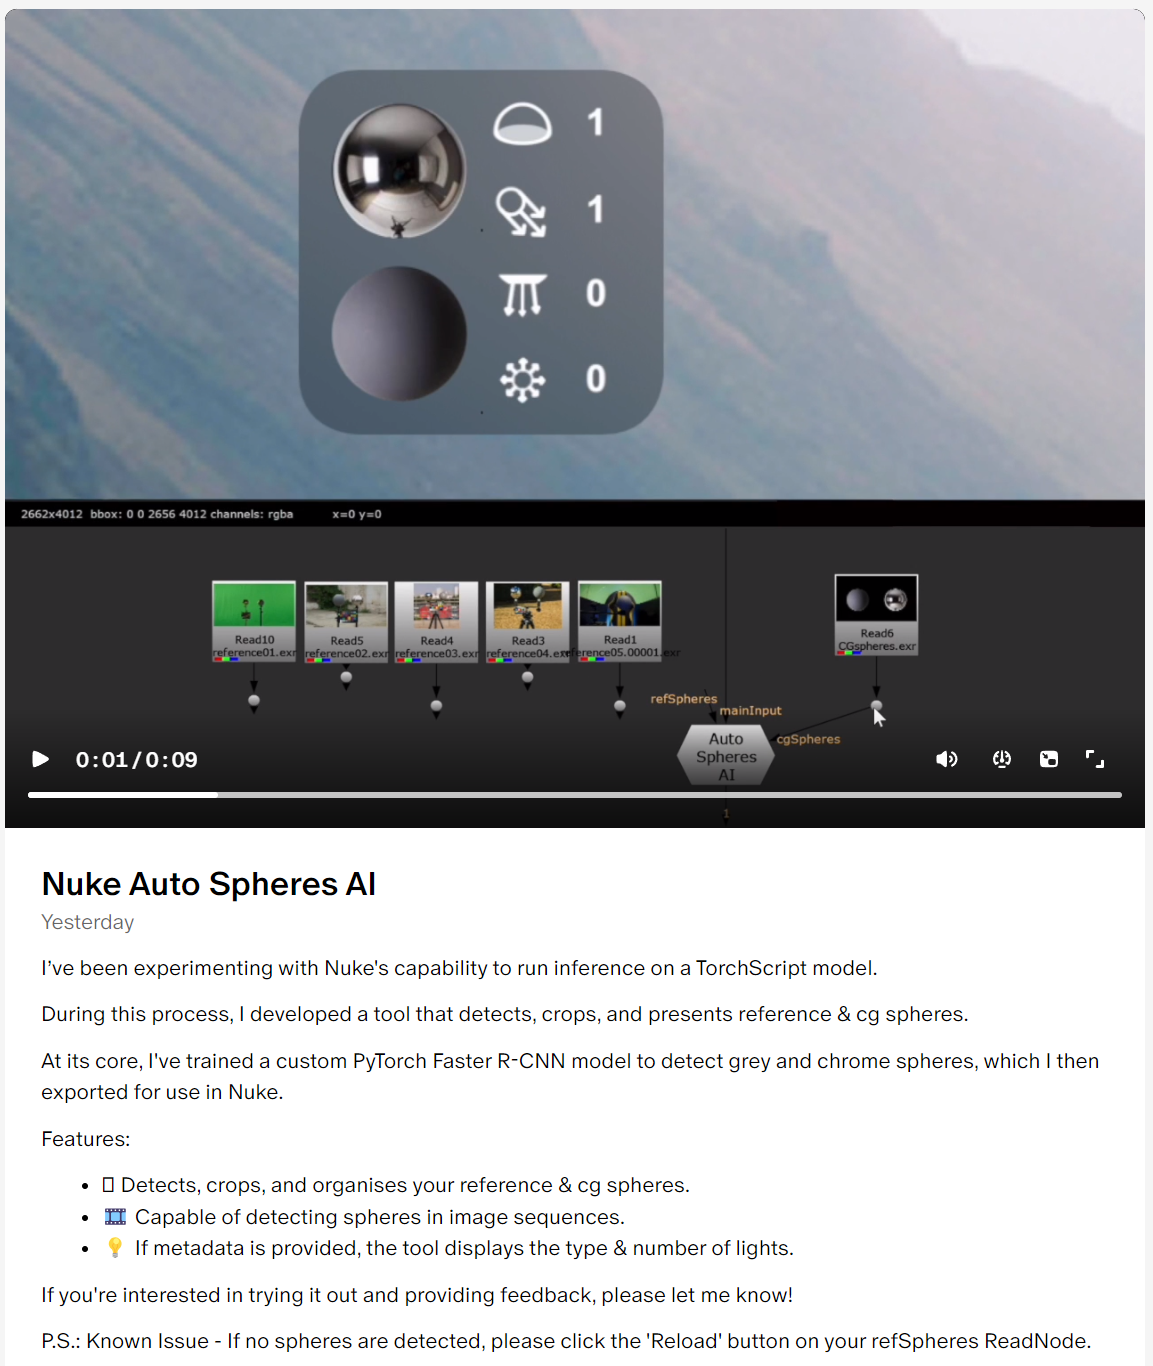
Paul d’Herbermont – Nuke HDRI model detection with TorchScript
A tool that detects, crops, and presents reference & cg spheres
https://www.patreon.com/posts/nuke-auto-ai-96524139
DiffusionLight: HDRI Light Probes for Free by Painting a Chrome Ball
https://diffusionlight.github.io/
https://github.com/DiffusionLight/DiffusionLight
https://github.com/DiffusionLight/DiffusionLight?tab=MIT-1-ov-file#readme
https://colab.research.google.com/drive/15pC4qb9mEtRYsW3utXkk-jnaeVxUy-0S
“a simple yet effective technique to estimate lighting in a single input image. Current techniques rely heavily on HDR panorama datasets to train neural networks to regress an input with limited field-of-view to a full environment map. However, these approaches often struggle with real-world, uncontrolled settings due to the limited diversity and size of their datasets. To address this problem, we leverage diffusion models trained on billions of standard images to render a chrome ball into the input image. Despite its simplicity, this task remains challenging: the diffusion models often insert incorrect or inconsistent objects and cannot readily generate images in HDR format. Our research uncovers a surprising relationship between the appearance of chrome balls and the initial diffusion noise map, which we utilize to consistently generate high-quality chrome balls. We further fine-tune an LDR difusion model (Stable Diffusion XL) with LoRA, enabling it to perform exposure bracketing for HDR light estimation. Our method produces convincing light estimates across diverse settings and demonstrates superior generalization to in-the-wild scenarios.”


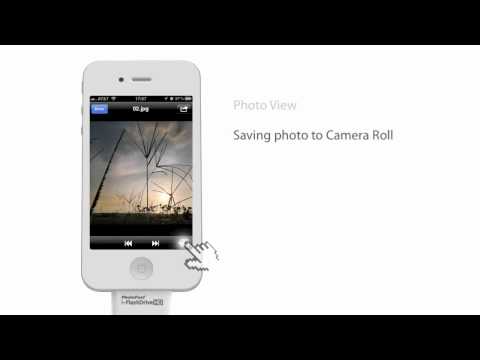
Fast, optimized ‘for’ pixel loops with OpenCV and Python to create tone mapped HDR images
https://pyimagesearch.com/2017/08/28/fast-optimized-for-pixel-loops-with-opencv-and-python/
https://learnopencv.com/exposure-fusion-using-opencv-cpp-python/
Exposure Fusion is a method for combining images taken with different exposure settings into one image that looks like a tone mapped High Dynamic Range (HDR) image.

HDRI Resources
Text2Light
- https://www.cgtrader.com/free-3d-models/exterior/other/10-free-hdr-panoramas-created-with-text2light-zero-shot
- https://frozenburning.github.io/projects/text2light/
- https://github.com/FrozenBurning/Text2Light
Royalty free links
- https://locationtextures.com/panoramas/
- http://www.noahwitchell.com/freebies
- https://polyhaven.com/hdris
- https://hdrmaps.com/
- https://www.ihdri.com/
- https://hdrihaven.com/
- https://www.domeble.com/
- http://www.hdrlabs.com/sibl/archive.html
- https://www.hdri-hub.com/hdrishop/hdri
- http://noemotionhdrs.net/hdrevening.html
- https://www.openfootage.net/hdri-panorama/
- https://www.zwischendrin.com/en/browse/hdri
Nvidia GauGAN360


NVIDIA GauGAN360 – AI driven latlong HDRI creation tool

https://blogs.nvidia.com/blog/2022/08/09/neural-graphics-sdk-metaverse-content/
Unfortunately, png output only at the moment:
http://imaginaire.cc/gaugan360/
Erik Winquist – The Definitive Weta Digital Guide to IBL hdri capture
www.fxguide.com/fxfeatured/the-definitive-weta-digital-guide-to-ibl
Notes:
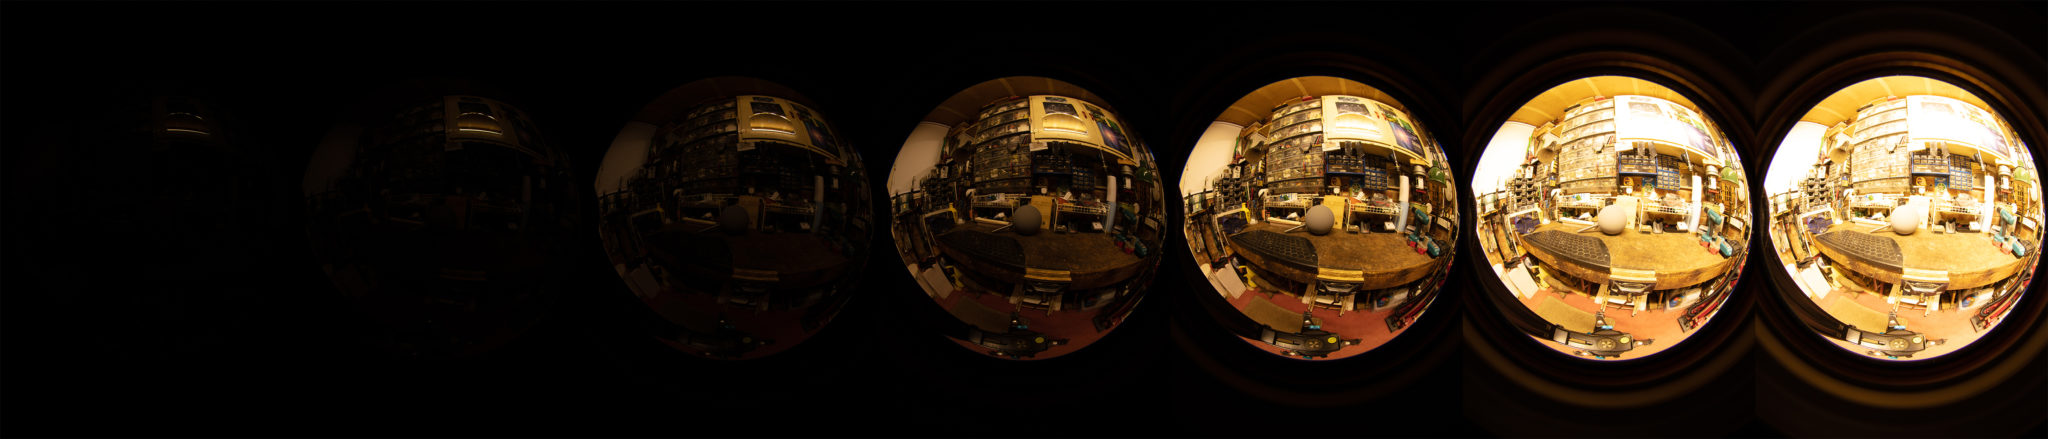
- Camera type: full frame with exposure bracketing and an 8mm circular fish eye lens.
- Bracketing: 7 exposures at 2 stops increments.
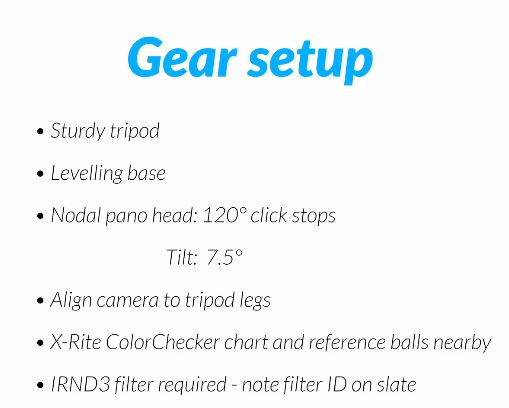
- Tripod: supporting 120 degrees locked offsets
- Camera angle: should point up 7.5 degrees for better sky or upper dome coverage.
- Camera focus: set and tape locked to manual
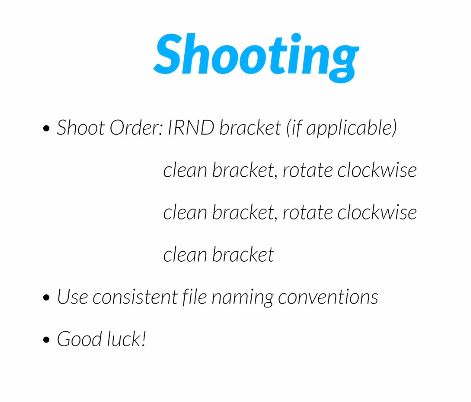
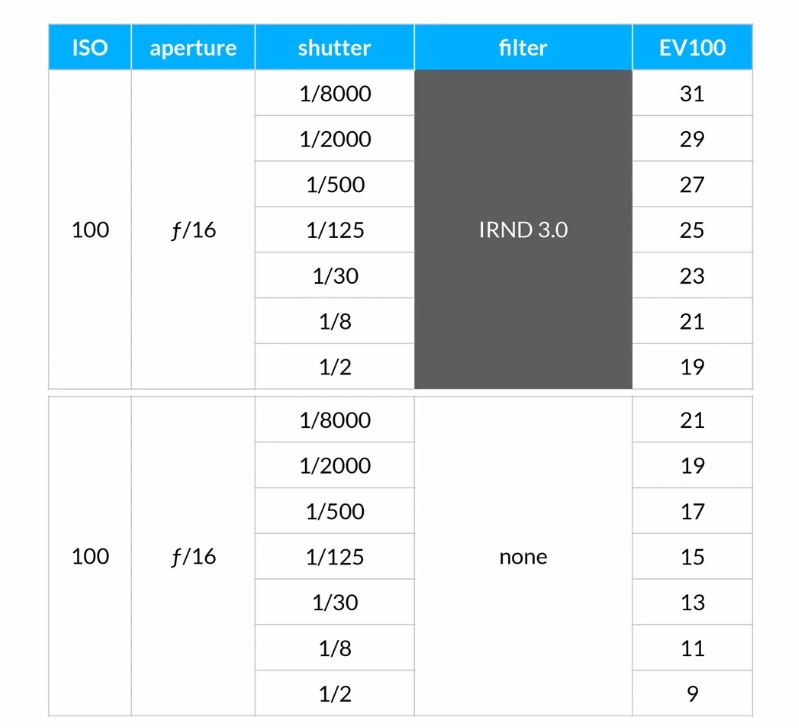
- Start shooting looking towards the sun direction with and without the ND3 filter; The other angles will not require the ND3 filter.
- Documenting shooting with a slate (measure distance to slate, day, location, camera info, camera temperature, camera position)


HDRI shooting and editing by Xuan Prada and Greg Zaal
www.xuanprada.com/blog/2014/11/3/hdri-shooting
http://blog.gregzaal.com/2016/03/16/make-your-own-hdri/
http://blog.hdrihaven.com/how-to-create-high-quality-hdri/
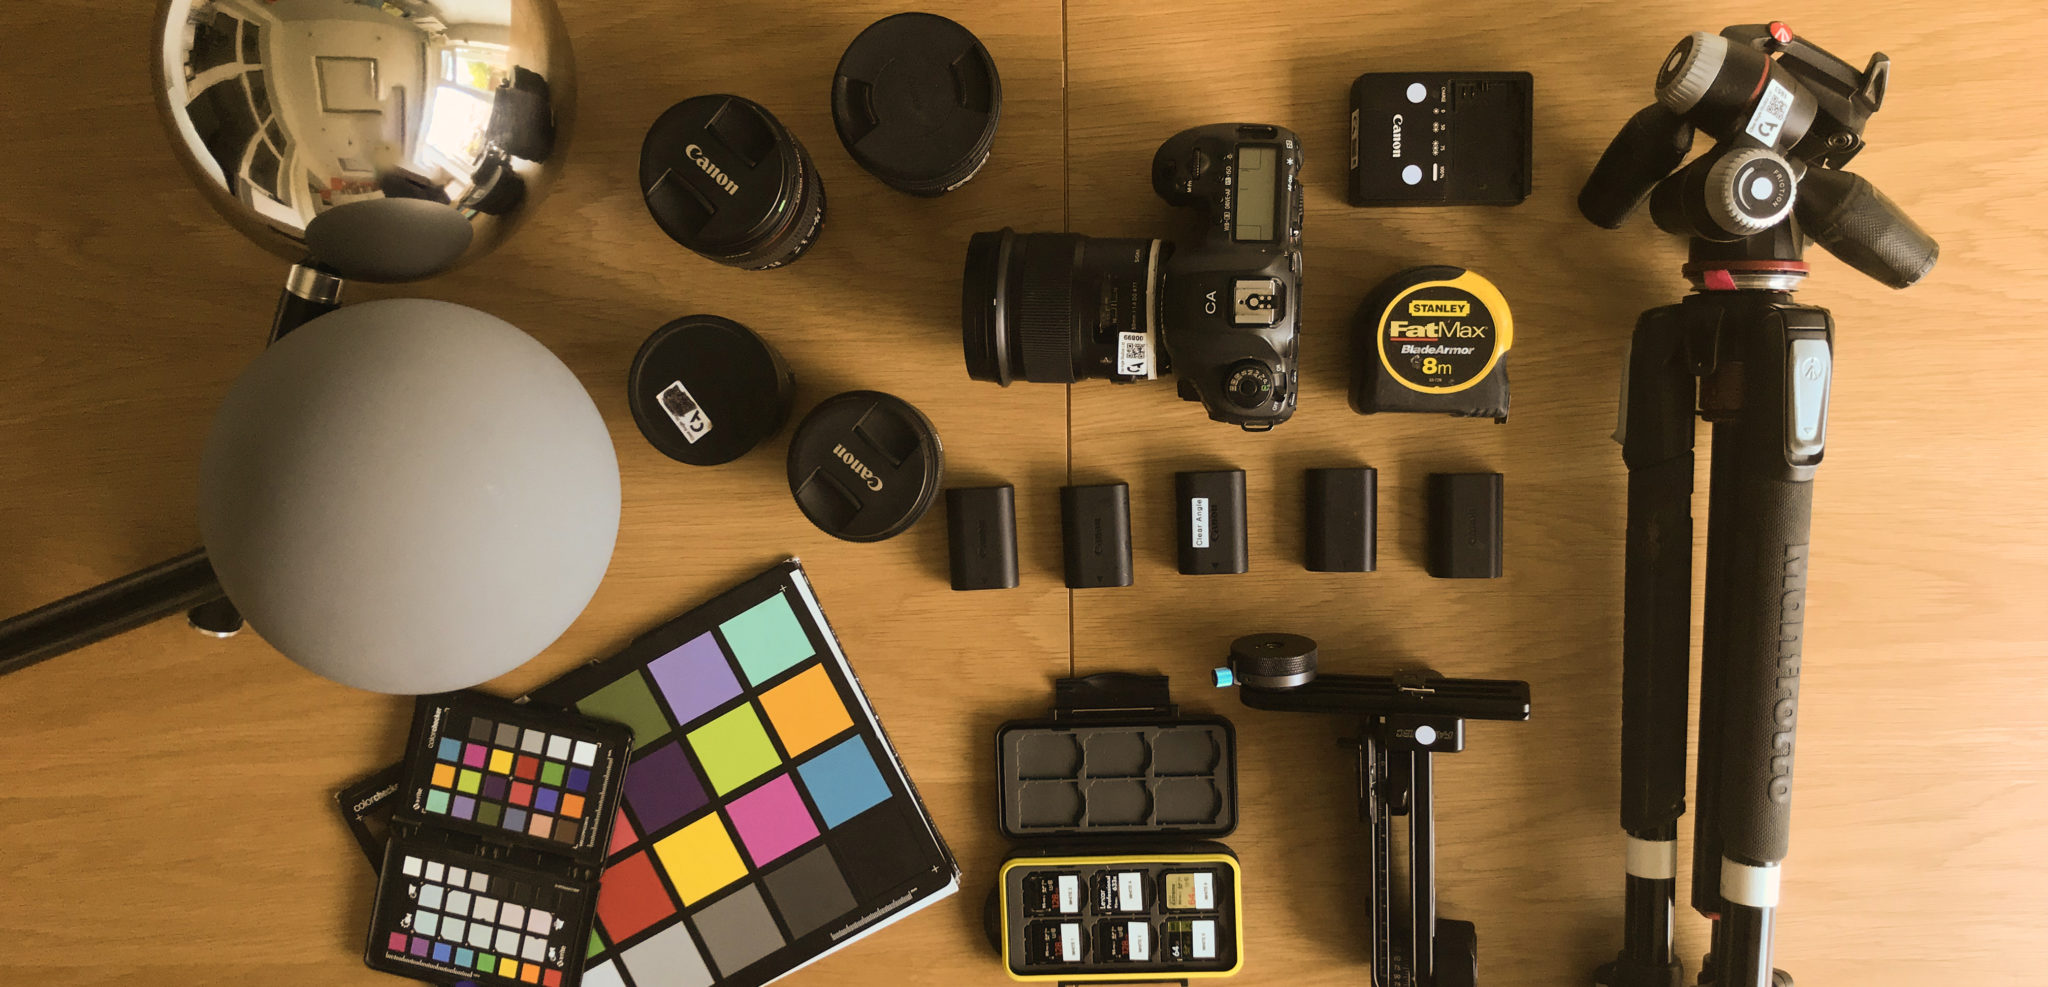
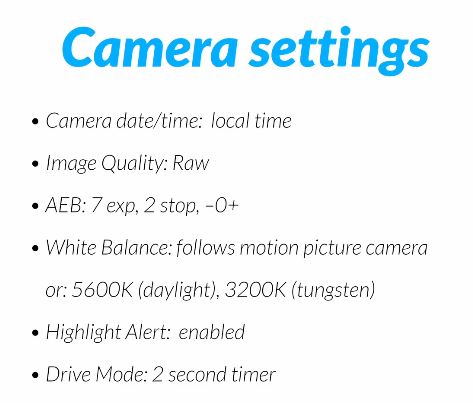
Shooting checklist
- Full coverage of the scene (fish-eye shots)
- Backplates for look-development (including ground or floor)
- Macbeth chart for white balance
- Grey ball for lighting calibration
- Chrome ball for lighting orientation
- Basic scene measurements
- Material samples
- Individual HDR artificial lighting sources if required
Methodology
- Plant the tripod where the action happens, stabilise it and level it
- Set manual focus
- Set white balance
- Set ISO
- Set raw+jpg
- Set apperture
- Metering exposure
- Set neutral exposure
- Read histogram and adjust neutral exposure if necessary
- Shot slate (operator name, location, date, time, project code name, etc)
- Set auto bracketing
- Shot 5 to 7 exposures with 3 stops difference covering the whole environment
- Place the aromatic kit where the tripod was placed, and take 3 exposures. Keep half of the grey sphere hit by the sun and half in shade.
- Place the Macbeth chart 1m away from tripod on the floor and take 3 exposures
- Take backplates and ground/floor texture references
- Shoot reference materials
- Write down measurements of the scene, specially if you are shooting interiors.
- If shooting artificial lights take HDR samples of each individual lighting source.
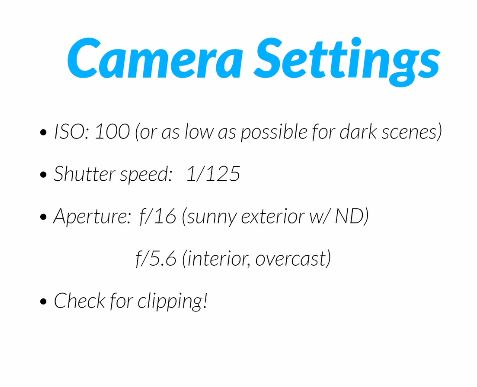
Exposures starting point
- Day light sun visible ISO 100 F22
- Day light sun hidden ISO 100 F16
- Cloudy ISO 320 F16
- Sunrise/Sunset ISO 100 F11
- Interior well lit ISO 320 F16
- Interior ambient bright ISO 320 F10
- Interior bad light ISO 640 F10
- Interior ambient dark ISO 640 F8
- Low light situation ISO 640 F5

Free HDRI libraries
noahwitchell.com
http://www.noahwitchell.com/freebies
locationtextures.com
https://locationtextures.com/panoramas/
maxroz.com
https://www.maxroz.com/hdri/list
HDRI Haven
https://hdrihaven.com/
Poly Haven
https://polyhaven.com/hdris
Domeble
https://www.domeble.com/
IHDRI
https://www.ihdri.com/
HDRMaps
https://hdrmaps.com/
NoEmotionHdrs.net
http://noemotionhdrs.net/hdrday.html
OpenFootage.net
https://www.openfootage.net/hdri-panorama/
HDRI-hub
https://www.hdri-hub.com/hdrishop/hdri
.zwischendrin
https://www.zwischendrin.com/en/browse/hdri
Longer list here:
https://cgtricks.com/list-sites-free-hdri/

HDRI Median Cut plugin
www.hdrlabs.com/picturenaut/plugins.html

Note. The Median Cut algorithm is typically used for color quantization, which involves reducing the number of colors in an image while preserving its visual quality. It doesn’t directly provide a way to identify the brightest areas in an image. However, if you’re interested in identifying the brightest areas, you might want to look into other methods like thresholding, histogram analysis, or edge detection, through openCV for example.
Here is an openCV example:
# bottom left coordinates = 0,0
import numpy as np
import cv2

# Load the HDR or EXR image
image = cv2.imread('your_image_path.exr', cv2.IMREAD_UNCHANGED)  # Load as-is without modification

# Calculate the luminance from the HDR channels (assuming RGB format)
luminance = np.dot(image[..., :3], [0.299, 0.587, 0.114])

# Set a threshold value based on estimated EV
threshold_value = 2.4  # Estimated threshold value based on 4.8 EV

# Apply the threshold to identify bright areas
# The luminance array contains the calculated luminance values for each pixel in the image. # The threshold_value is a user-defined value that represents a cutoff point, separating "bright" and "dark" areas in terms of perceived luminance.
thresholded = (luminance > threshold_value) * 255

# Convert the thresholded image to uint8 for contour detection
thresholded = thresholded.astype(np.uint8)

# Find contours of the bright areas
contours, _ = cv2.findContours(thresholded, cv2.RETR_EXTERNAL, cv2.CHAIN_APPROX_SIMPLE)

# Create a list to store the bounding boxes of bright areas
bright_areas = []

# Iterate through contours and extract bounding boxes for contour in contours:
x, y, w, h = cv2.boundingRect(contour)

# Adjust y-coordinate based on bottom-left origin
y_bottom_left_origin = image.shape[0] - (y + h) bright_areas.append((x, y_bottom_left_origin, x + w, y_bottom_left_origin + h))

# Store as (x1, y1, x2, y2)
# Print the identified bright areas
print("Bright Areas (x1, y1, x2, y2):") for area in bright_areas: print(area)
More details
Luminance and Exposure in an EXR Image:
- An EXR (Extended Dynamic Range) image format is often used to store high dynamic range (HDR) images that contain a wide range of luminance values, capturing both dark and bright areas.
- Luminance refers to the perceived brightness of a pixel in an image. In an RGB image, luminance is often calculated using a weighted sum of the red, green, and blue channels, where different weights are assigned to each channel to account for human perception.
- In an EXR image, the pixel values can represent radiometrically accurate scene values, including actual radiance or irradiance levels. These values are directly related to the amount of light emitted or reflected by objects in the scene.
The luminance line is calculating the luminance of each pixel in the image using a weighted sum of the red, green, and blue channels. The three float values [0.299, 0.587, 0.114] are the weights used to perform this calculation.
These weights are based on the concept of luminosity, which aims to approximate the perceived brightness of a color by taking into account the human eye’s sensitivity to different colors. The values are often derived from the NTSC (National Television System Committee) standard, which is used in various color image processing operations.
Here’s the breakdown of the float values:
- 0.299: Weight for the red channel.
- 0.587: Weight for the green channel.
- 0.114: Weight for the blue channel.
The weighted sum of these channels helps create a grayscale image where the pixel values represent the perceived brightness. This technique is often used when converting a color image to grayscale or when calculating luminance for certain operations, as it takes into account the human eye’s sensitivity to different colors.
For the threshold, remember that the exact relationship between EV values and pixel values can depend on the tone-mapping or normalization applied to the HDR image, as well as the dynamic range of the image itself.
To establish a relationship between exposure and the threshold value, you can consider the relationship between linear and logarithmic scales:
- Linear and Logarithmic Scales:
- Exposure values in an EXR image are often represented in logarithmic scales, such as EV (exposure value). Each increment in EV represents a doubling or halving of the amount of light captured.
- Threshold values for luminance thresholding are usually linear, representing an actual luminance level.
- Conversion Between Scales:
- To establish a mathematical relationship, you need to convert between the logarithmic exposure scale and the linear threshold scale.
- One common method is to use a power function. For instance, you can use a power function to convert EV to a linear intensity value.
threshold_value = base_value * (2 ** EV)
Here,
EVis the exposure value,base_valueis a scaling factor that determines the relationship between EV and threshold_value, and2 ** EVis used to convert the logarithmic EV to a linear intensity value. - Choosing the Base Value:
- The
base_valuefactor should be determined based on the dynamic range of your EXR image and the specific luminance values you are dealing with. - You may need to experiment with different values of
base_valueto achieve the desired separation of bright areas from the rest of the image.
- The
Let’s say you have an EXR image with a dynamic range of 12 EV, which is a common range for many high dynamic range images. In this case, you want to set a threshold value that corresponds to a certain number of EV above the middle gray level (which is often considered to be around 0.18).
Here’s an example of how you might determine a base_value to achieve this:
# Define the dynamic range of the image in EV
dynamic_range = 12

# Choose the desired number of EV above middle gray for thresholding
desired_ev_above_middle_gray = 2

# Calculate the threshold value based on the desired EV above middle gray
threshold_value = 0.18 * (2 ** (desired_ev_above_middle_gray / dynamic_range))

print("Threshold Value:", threshold_value)
Polyfjord – Blender Simulations in HDR


Smoke simulations in Blender

Capturing the world in HDR for real time projects – Call of Duty: Advanced Warfare
Real-World Measurements for Call of Duty: Advanced Warfare
www.activision.com/cdn/research/Real_World_Measurements_for_Call_of_Duty_Advanced_Warfare.pdf
Local version
Real_World_Measurements_for_Call_of_Duty_Advanced_Warfare.pdf

domeble – Hi-Resolution CGI Backplates and 360° HDRI
When collecting hdri make sure the data supports basic metadata, such as:
- Iso
- Aperture
- Exposure time or shutter time
- Color temperature
- Color space Exposure value (what the sensor receives of the sun intensity in lux)
- 7+ brackets (with 5 or 6 being the perceived balanced exposure)
In image processing, computer graphics, and photography, high dynamic range imaging (HDRI or just HDR) is a set of techniques that allow a greater dynamic range of luminances (a Photometry measure of the luminous intensity per unit area of light travelling in a given direction. It describes the amount of light that passes through or is emitted from a particular area, and falls within a given solid angle) between the lightest and darkest areas of an image than standard digital imaging techniques or photographic methods. This wider dynamic range allows HDR images to represent more accurately the wide range of intensity levels found in real scenes ranging from direct sunlight to faint starlight and to the deepest shadows.
The two main sources of HDR imagery are computer renderings and merging of multiple photographs, which in turn are known as low dynamic range (LDR) or standard dynamic range (SDR) images. Tone Mapping (Look-up) techniques, which reduce overall contrast to facilitate display of HDR images on devices with lower dynamic range, can be applied to produce images with preserved or exaggerated local contrast for artistic effect. Photography
In photography, dynamic range is measured in Exposure Values (in photography, exposure value denotes all combinations of camera shutter speed and relative aperture that give the same exposure. The concept was developed in Germany in the 1950s) differences or stops, between the brightest and darkest parts of the image that show detail. An increase of one EV or one stop is a doubling of the amount of light.
The human response to brightness is well approximated by a Steven’s power law, which over a reasonable range is close to logarithmic, as described by the Weber�Fechner law, which is one reason that logarithmic measures of light intensity are often used as well.
HDR is short for High Dynamic Range. It’s a term used to describe an image which contains a greater exposure range than the “black” to “white” that 8 or 16-bit integer formats (JPEG, TIFF, PNG) can describe. Whereas these Low Dynamic Range images (LDR) can hold perhaps 8 to 10 f-stops of image information, HDR images can describe beyond 30 stops and stored in 32 bit images.

HDR and Color
https://www.soundandvision.com/content/nits-and-bits-hdr-and-color
In HD we often refer to the range of available colors as a color gamut. Such a color gamut is typically plotted on a two-dimensional diagram, called a CIE chart, as shown in at the top of this blog. Each color is characterized by its x/y coordinates.

Good enough for government work, perhaps. But for HDR, with its higher luminance levels and wider color, the gamut becomes three-dimensional.

For HDR the color gamut therefore becomes a characteristic we now call the color volume. It isn’t easy to show color volume on a two-dimensional medium like the printed page or a computer screen, but one method is shown below. As the luminance becomes higher, the picture eventually turns to white. As it becomes darker, it fades to black. The traditional color gamut shown on the CIE chart is simply a slice through this color volume at a selected luminance level, such as 50%.
Three different color volumes—we still refer to them as color gamuts though their third dimension is important—are currently the most significant. The first is BT.709 (sometimes referred to as Rec.709), the color gamut used for pre-UHD/HDR formats, including standard HD.
The largest is known as BT.2020; it encompasses (roughly) the range of colors visible to the human eye (though ET might find it insufficient!).
Between these two is the color gamut used in digital cinema, known as DCI-P3.

sRGB

D65


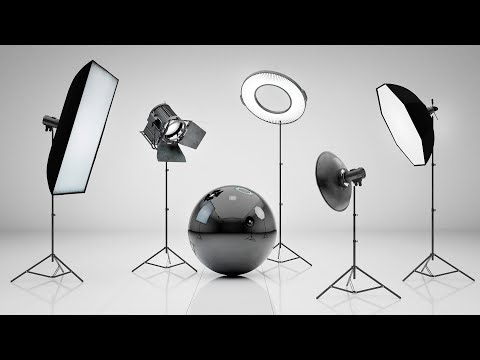
Romain Chauliac – LightIt a lighting script for Maya and Arnold
LightIt is a script for Maya and Arnold that will help you and improve your lighting workflow.
Thanks to preset studio lighting components (lights, backdrop…), high quality studio scenes and HDRI library manager.
https://www.artstation.com/artwork/393emJ
Simulon – a Hollywood production studio in the hands of an independent creator with access to consumer hardware
Divesh Naidoo: The video below was made with a live in-camera preview and auto-exposure matching, no camera solve, no HDRI capture and no manual compositing setup. Using the new Simulon phone app.
LDR to HDR through ML
https://simulon.typeform.com/betatest
Process example
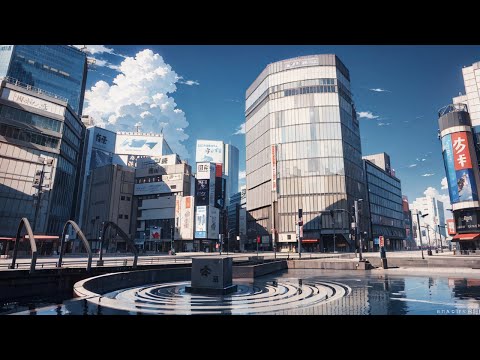
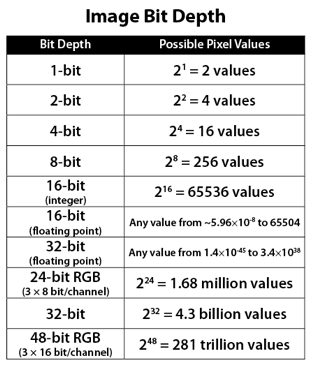
Image rendering bit depth
The terms 16-bit, 16-bit float, and 32-bit refer to different data formats used to store and represent image information, as bits per pixel.
https://en.wikipedia.org/wiki/Color_depth
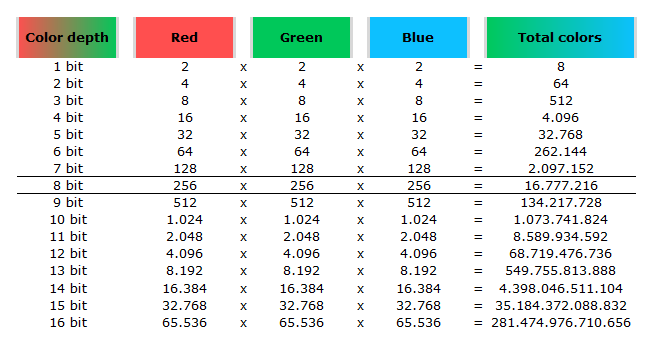
In color technology, color depth also known as bit depth, is either the number of bits used to indicate the color of a single pixel, OR the number of bits used for each color component of a single pixel.
When referring to a pixel, the concept can be defined as bits per pixel (bpp).
When referring to a color component, the concept can be defined as bits per component, bits per channel, bits per color (all three abbreviated bpc), and also bits per pixel component, bits per color channel or bits per sample (bps). Modern standards tend to use bits per component, but historical lower-depth systems used bits per pixel more often.
Color depth is only one aspect of color representation, expressing the precision with which the amount of each primary can be expressed; the other aspect is how broad a range of colors can be expressed (the gamut). The definition of both color precision and gamut is accomplished with a color encoding specification which assigns a digital code value to a location in a color space.

Here’s a simple explanation of each.
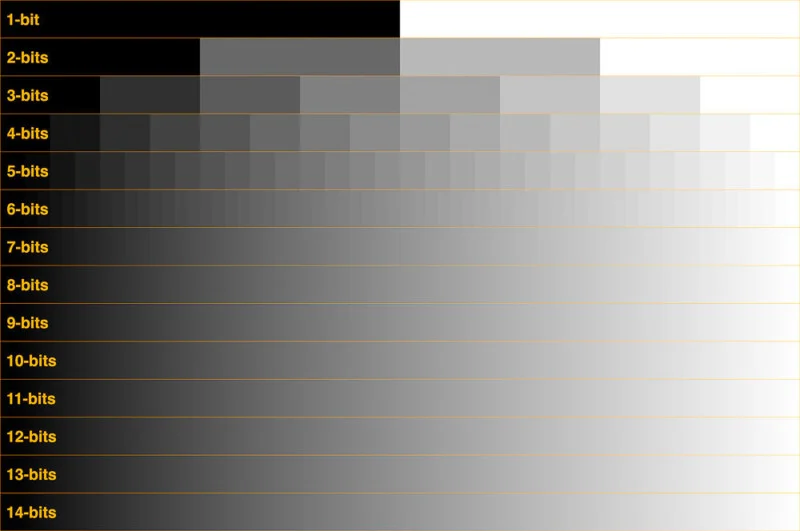
8-bit images (i.e. 24 bits per pixel for a color image) are considered Low Dynamic Range.
16-bit: This format is commonly referred to as “half-precision.” It uses 16 bits of data to represent color values for each pixel. With 16 bits, you can have 65,536 discrete levels of color, allowing for relatively high precision and smooth gradients. However, it has a limited dynamic range, meaning it cannot accurately represent extremely bright or dark values. It is commonly used for regular images and textures.
16-bit float: This format is an extension of the 16-bit format but uses floating-point numbers instead of fixed integers. Floating-point numbers allow for more precise calculations and a larger dynamic range. In this case, the 16 bits are used to store both the color value and the exponent, which controls the range of values that can be represented. The 16-bit float format provides better accuracy and a wider dynamic range than regular 16-bit, making it useful for high-dynamic-range imaging (HDRI) and computations that require more precision.
32-bit: (i.e. 96 bits per pixel for a color image) are considered High Dynamic Range. This format, also known as “full-precision” or “float,” uses 32 bits to represent color values and offers the highest precision and dynamic range among the three options. With 32 bits, you have a significantly larger number of discrete levels, allowing for extremely accurate color representation, smooth gradients, and a wide range of brightness values. It is commonly used for professional rendering, visual effects, and scientific applications where maximum precision is required.
Bits and HDR coverage
High Dynamic Range (HDR) images are designed to capture a wide range of luminance values, from the darkest shadows to the brightest highlights, in order to reproduce a scene with more accuracy and detail. The bit depth of an image refers to the number of bits used to represent each pixel’s color information. When comparing 32-bit float and 16-bit float HDR images, the drop in accuracy primarily relates to the precision of the color information.
A 32-bit float HDR image offers a higher level of precision compared to a 16-bit float HDR image. In a 32-bit float format, each color channel (red, green, and blue) is represented by 32 bits, allowing for a larger range of values to be stored. This increased precision enables the image to retain more details and subtleties in color and luminance.
On the other hand, a 16-bit float HDR image utilizes 16 bits per color channel, resulting in a reduced range of values that can be represented. This lower precision leads to a loss of fine details and color nuances, especially in highly contrasted areas of the image where there are significant differences in luminance.
The drop in accuracy between 32-bit and 16-bit float HDR images becomes more noticeable as the exposure range of the scene increases. Exposure range refers to the span between the darkest and brightest areas of an image. In scenes with a limited exposure range, where the luminance differences are relatively small, the loss of accuracy may not be as prominent or perceptible. These images usually are around 8-10 exposure levels.
However, in scenes with a wide exposure range, such as a landscape with deep shadows and bright highlights, the reduced precision of a 16-bit float HDR image can result in visible artifacts like color banding, posterization, and loss of detail in both shadows and highlights. The image may exhibit abrupt transitions between tones or colors, which can appear unnatural and less realistic.
To provide a rough estimate, it is often observed that exposure values beyond approximately ±6 to ±8 stops from the middle gray (18% reflectance) may be more prone to accuracy issues in a 16-bit float format. This range may vary depending on the specific implementation and encoding scheme used.
To summarize, the drop in accuracy between 32-bit and 16-bit float HDR images is mainly related to the reduced precision of color information. This decrease in precision becomes more apparent in scenes with a wide exposure range, affecting the representation of fine details and leading to visible artifacts in the image.
In practice, this means that exposure values beyond a certain range will experience a loss of accuracy and detail when stored in a 16-bit float format. The exact range at which this loss occurs depends on the encoding scheme and the specific implementation. However, in general, extremely bright or extremely dark values that fall outside the representable range may be subject to quantization errors, resulting in loss of detail, banding, or other artifacts.
HDRs used for lighting purposes are usually slightly convolved to improve on sampling speed and removing specular artefacts. To that extent, 16 bit float HDRIs tend to me most used in CG cycles.
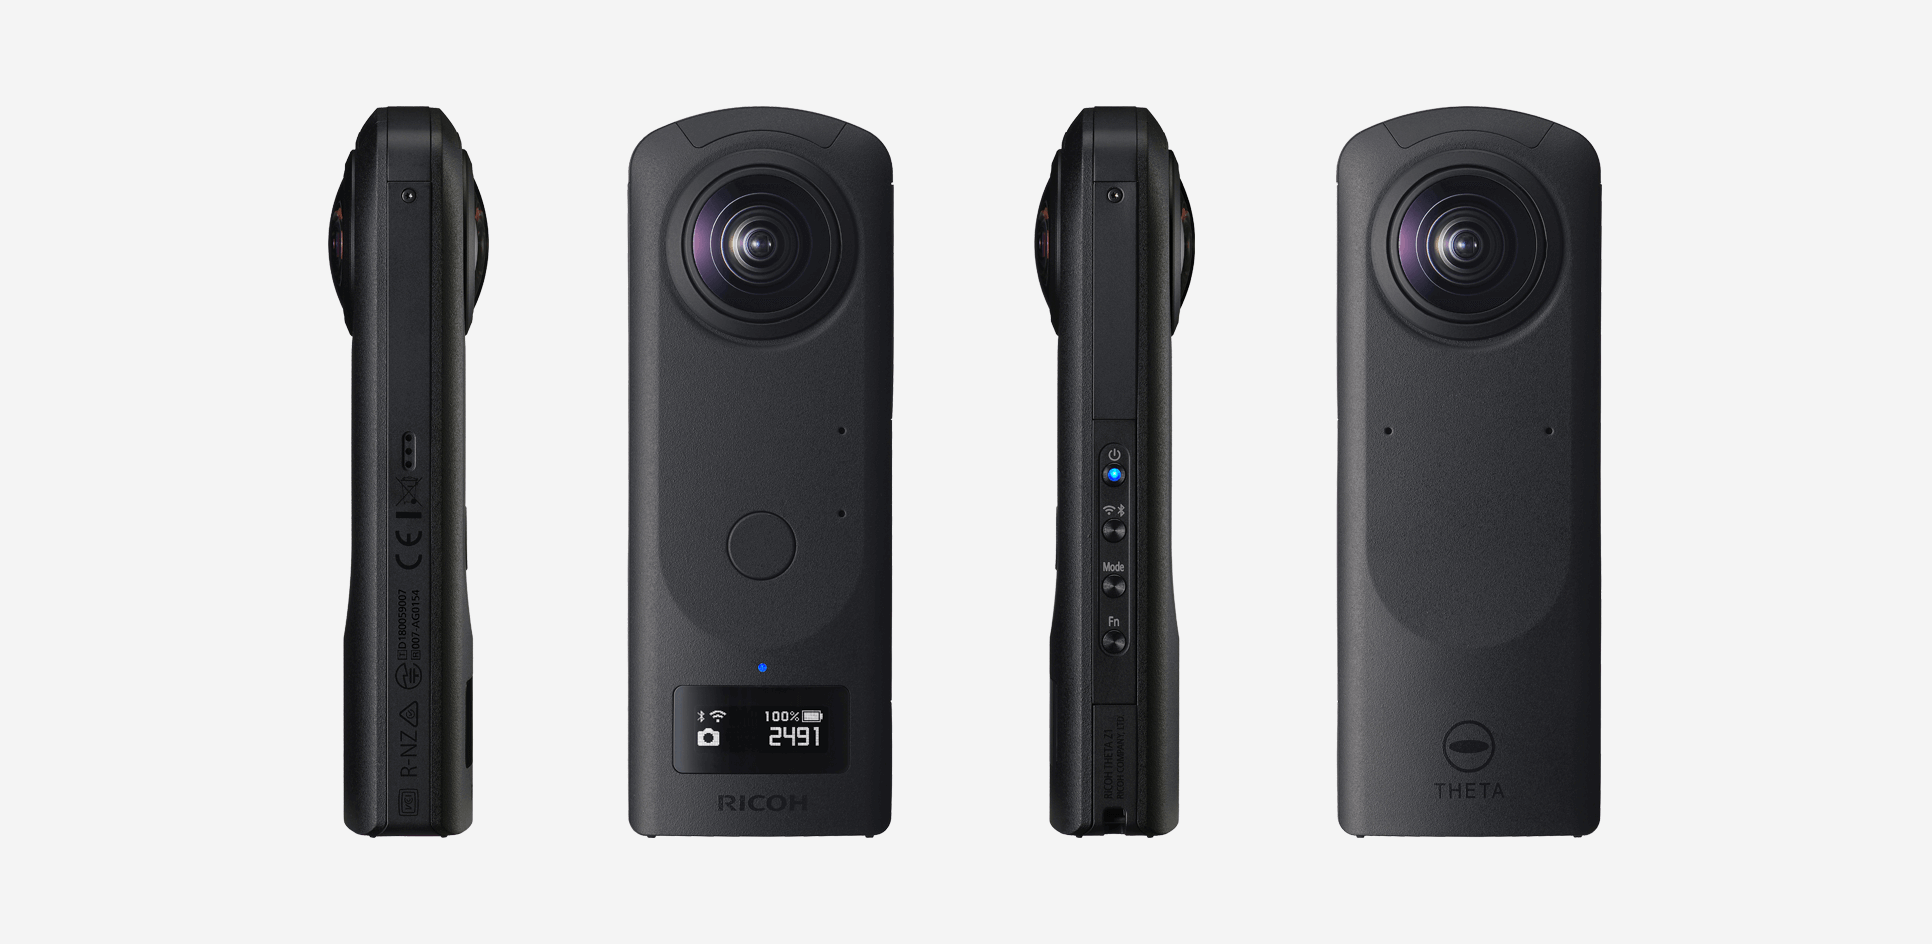
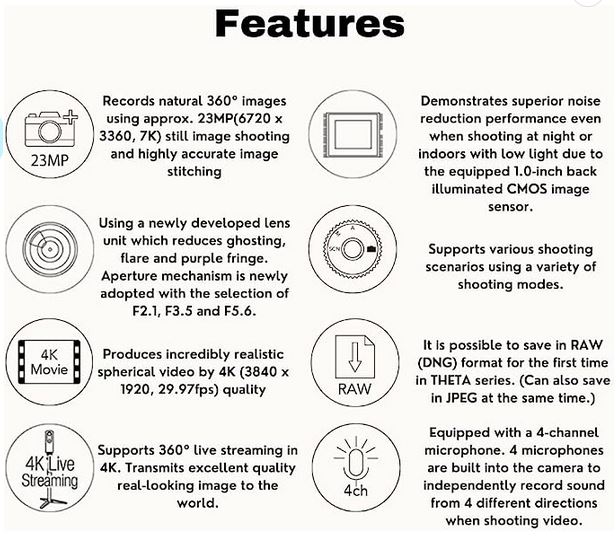
RICOH THETA Z1 51GB camera – 360° images in RAW format
https://theta360.com/en/about/theta/z1.html
- 23MP(6720 x 3360, 7K)
- superior noise reduction performance
- F2.1, F3.5 and F5.6
- 4K videos (3840 x 1920, 29.97fps)
- RAW (DNG) image format
- 360° live streaming in 4K
- record sound from 4 different directions when shooting video
- editing of 360° images in Adobe Photoshop Lightroom Classic CC
- Android™ base system for the OS. Use plug-ins to customize your own THETA.
- Wireless 2.4 GHz: 1 to 11ch or 1 to 13ch
- Wireless 5 GHz: W52 (36 to 48ch, channel bandwidth 20/40/80 MHz supported)
Theta Z1 is Ricoh’s flagship 360 camera that features 1-inch sensors, which are the largest available for dual lens 360 cameras. It has been a highly regarded camera among 360 photographers because of its excellent image quality, color accuracy, and its ability to shoot Raw DNG photos with exceptional exposure latitude.
Bracketing mode 2022
Rquirement: Basic app iOS ver.2.20.0, Android ver.2.5.0, Camera firmware ver.2.10.3
https://community.theta360.guide/t/new-feature-ae-bracket-added-in-the-shooting-mode-z1-only/8247
HDRi for VFX
https://community.theta360.guide/t/create-high-quality-hdri-for-vfx-using-ricoh-theta-z1/4789/4
ND filtering
https://community.theta360.guide/t/neutral-density-solution-for-most-theta-cameras/7331
https://community.theta360.guide/t/long-exposure-nd-filter-for-ricoh-theta/1100
LUX vs LUMEN vs NITS vs CANDELA – What is the difference
More details here: Lumens vs Candelas (candle) vs Lux vs FootCandle vs Watts vs Irradiance vs Illuminance


https://www.inhouseav.com.au/blog/beginners-guide-nits-lumens-brightness/

Candela
Candela is the basic unit of measure of the entire volume of light intensity from any point in a single direction from a light source. Note the detail: it measures the total volume of light within a certain beam angle and direction.
While the luminance of starlight is around 0.001 cd/m2, that of a sunlit scene is around 100,000 cd/m2, which is a hundred millions times higher. The luminance of the sun itself is approximately 1,000,000,000 cd/m2.
NIT
https://en.wikipedia.org/wiki/Candela_per_square_metre
The candela per square metre (symbol: cd/m2) is the unit of luminance in the International System of Units (SI). The unit is based on the candela, the SI unit of luminous intensity, and the square metre, the SI unit of area. The nit (symbol: nt) is a non-SI name also used for this unit (1 nt = 1 cd/m2).[1] The term nit is believed to come from the Latin word nitēre, “to shine”. As a measure of light emitted per unit area, this unit is frequently used to specify the brightness of a display device.
NIT and cd/m2 (candela power) represent the same thing and can be used interchangeably. One nit is equivalent to one candela per square meter, where the candela is the amount of light which has been emitted by a common tallow candle, but NIT is not part of the International System of Units (abbreviated SI, from Systeme International, in French).
It’s easiest to think of a TV as emitting light directly, in much the same way as the Sun does. Nits are simply the measurement of the level of light (luminance) in a given area which the emitting source sends to your eyes or a camera sensor.
The Nit can be considered a unit of visible-light intensity which is often used to specify the brightness level of an LCD.
1 Nit is approximately equal to 3.426 Lumens. To work out a comparable number of Nits to Lumens, you need to multiply the number of Nits by 3.426. If you know the number of Lumens, and wish to know the Nits, simply divide the number of Lumens by 3.426.
Most consumer desktop LCDs have Nits of 200 to 300, the average TV most likely has an output capability of between 100 and 200 Nits, and an HDR TV ranges from 400 to 1,500 Nits.
Virtual Production sets currently sport around 6000 NIT ceiling and 1000 NIT wall panels.
The ambient brightness of a sunny day with clear blue skies is between 7000-10,000 nits (between 3000-7000 nits for overcast skies and indirect sunlight).
A bright sunny day can have specular highlights that reach over 100,000 nits. Direct sunlight is around 1,600,000,000 nits.
10,000 nits is also the typical brightness of a fluorescent tube – bright, but not painful to look at.

https://www.displaydaily.com/article/display-daily/dolby-vision-vs-hdr10-clarified
Tests showed that a “black level” of 0.005 nits (cd/m²) satisfied the vast majority of viewers. While 0.005 nits is very close to true black, Griffis says Dolby can go down to a black of 0.0001 nits, even though there is no need or ability for displays to get that dark today.
How bright is white? Dolby says the range of 0.005 nits – 10,000 nits satisfied 84% of the viewers in their viewing tests.
The brightest consumer HDR displays today are about 1,500 nits. Professional displays where HDR content is color-graded can achieve up to 4,000 nits peak brightness.
High brightness that would be in danger of damaging the eye would be in the neighborhood of 250,000 nits.
Lumens
Lumen is a measure of how much light is emitted (luminance, luminous flux) by an object. It indicates the total potential amount of light from a light source that is visible to the human eye.
Lumen is commonly used in the context of light bulbs or video-projectors as a metric for their brightness power.
Lumen is used to describe light output, and about video projectors, it is commonly referred to as ANSI Lumens. Simply put, lumens is how to find out how bright a LED display is. The higher the lumens, the brighter to display!
Technically speaking, a Lumen is the SI unit of luminous flux, which is equal to the amount of light which is emitted per second in a unit solid angle of one steradian from a uniform source of one-candela intensity radiating in all directions.
LUX
Lux (lx) or often Illuminance, is a photometric unit along a given area, which takes in account the sensitivity of human eye to different wavelenghts. It is the measure of light at a specific distance within a specific area at that distance. Often used to measure the incidental sun’s intensity.