


COMPOSITION
-
StudioBinder – Roger Deakins on How to Choose a Camera Lens — Cinematography Composition Techniques
Read more: StudioBinder – Roger Deakins on How to Choose a Camera Lens — Cinematography Composition Techniques
https://www.studiobinder.com/blog/camera-lens-buying-guide/
https://www.studiobinder.com/blog/e-books/camera-lenses-explained-volume-1-ebook
-
Photography basics: Depth of Field and composition
Read more: Photography basics: Depth of Field and compositionDepth of field is the range within which focusing is resolved in a photo.
Aperture has a huge affect on to the depth of field.
Changing the f-stops (f/#) of a lens will change aperture and as such the DOF.
f-stops are a just certain number which is telling you the size of the aperture. That’s how f-stop is related to aperture (and DOF).
If you increase f-stops, it will increase DOF, the area in focus (and decrease the aperture). On the other hand, decreasing the f-stop it will decrease DOF (and increase the aperture).
The red cone in the figure is an angular representation of the resolution of the system. Versus the dotted lines, which indicate the aperture coverage. Where the lines of the two cones intersect defines the total range of the depth of field.
This image explains why the longer the depth of field, the greater the range of clarity.


DESIGN


COLOR
-
Tim Kang – calibrated white light values in sRGB color space
Read more: Tim Kang – calibrated white light values in sRGB color space8bit sRGB encoded
2000K 255 139 22
2700K 255 172 89
3000K 255 184 109
3200K 255 190 122
4000K 255 211 165
4300K 255 219 178
D50 255 235 205
D55 255 243 224
D5600 255 244 227
D6000 255 249 240
D65 255 255 255
D10000 202 221 255
D20000 166 196 2558bit Rec709 Gamma 2.4
2000K 255 145 34
2700K 255 177 97
3000K 255 187 117
3200K 255 193 129
4000K 255 214 170
4300K 255 221 182
D50 255 236 208
D55 255 243 226
D5600 255 245 229
D6000 255 250 241
D65 255 255 255
D10000 204 222 255
D20000 170 199 2558bit Display P3 encoded
2000K 255 154 63
2700K 255 185 109
3000K 255 195 127
3200K 255 201 138
4000K 255 219 176
4300K 255 225 187
D50 255 239 212
D55 255 245 228
D5600 255 246 231
D6000 255 251 242
D65 255 255 255
D10000 208 223 255
D20000 175 199 25510bit Rec2020 PQ (100 nits)
2000K 520 435 273
2700K 520 466 358
3000K 520 475 384
3200K 520 480 399
4000K 520 495 446
4300K 520 500 458
D50 520 510 482
D55 520 514 497
D5600 520 514 500
D6000 520 517 509
D65 520 520 520
D10000 479 489 520
D20000 448 464 520
-
FXGuide – ACES 2.0 with ILM’s Alex Fry
Read more: FXGuide – ACES 2.0 with ILM’s Alex Fry
https://draftdocs.acescentral.com/background/whats-new/
ACES 2.0 is the second major release of the components that make up the ACES system. The most significant change is a new suite of rendering transforms whose design was informed by collected feedback and requests from users of ACES 1. The changes aim to improve the appearance of perceived artifacts and to complete previously unfinished components of the system, resulting in a more complete, robust, and consistent product.
Highlights of the key changes in ACES 2.0 are as follows:
- New output transforms, including:
- A less aggressive tone scale
- More intuitive controls to create custom outputs to non-standard displays
- Robust gamut mapping to improve perceptual uniformity
- Improved performance of the inverse transforms
- Enhanced AMF specification
- An updated specification for ACES Transform IDs
- OpenEXR compression recommendations
- Enhanced tools for generating Input Transforms and recommended procedures for characterizing prosumer cameras
- Look Transform Library
- Expanded documentation
Rendering Transform
The most substantial change in ACES 2.0 is a complete redesign of the rendering transform.
ACES 2.0 was built as a unified system, rather than through piecemeal additions. Different deliverable outputs “match” better and making outputs to display setups other than the provided presets is intended to be user-driven. The rendering transforms are less likely to produce undesirable artifacts “out of the box”, which means less time can be spent fixing problematic images and more time making pictures look the way you want.
Key design goals
- Improve consistency of tone scale and provide an easy to use parameter to allow for outputs between preset dynamic ranges
- Minimize hue skews across exposure range in a region of same hue
- Unify for structural consistency across transform type
- Easy to use parameters to create outputs other than the presets
- Robust gamut mapping to improve harsh clipping artifacts
- Fill extents of output code value cube (where appropriate and expected)
- Invertible – not necessarily reversible, but Output > ACES > Output round-trip should be possible
- Accomplish all of the above while maintaining an acceptable “out-of-the box” rendering
- New output transforms, including:
-
Photography basics: Why Use a (MacBeth) Color Chart?
Read more: Photography basics: Why Use a (MacBeth) Color Chart?Start here: https://www.pixelsham.com/2013/05/09/gretagmacbeth-color-checker-numeric-values/
https://www.studiobinder.com/blog/what-is-a-color-checker-tool/


In LightRoom

in Final Cut

in Nuke
Note: In Foundry’s Nuke, the software will map 18% gray to whatever your center f/stop is set to in the viewer settings (f/8 by default… change that to EV by following the instructions below).
You can experiment with this by attaching an Exposure node to a Constant set to 0.18, setting your viewer read-out to Spotmeter, and adjusting the stops in the node up and down. You will see that a full stop up or down will give you the respective next value on the aperture scale (f8, f11, f16 etc.).One stop doubles or halves the amount or light that hits the filmback/ccd, so everything works in powers of 2.
So starting with 0.18 in your constant, you will see that raising it by a stop will give you .36 as a floating point number (in linear space), while your f/stop will be f/11 and so on.If you set your center stop to 0 (see below) you will get a relative readout in EVs, where EV 0 again equals 18% constant gray.

In other words. Setting the center f-stop to 0 means that in a neutral plate, the middle gray in the macbeth chart will equal to exposure value 0. EV 0 corresponds to an exposure time of 1 sec and an aperture of f/1.0.
This will set the sun usually around EV12-17 and the sky EV1-4 , depending on cloud coverage.
To switch Foundry’s Nuke’s SpotMeter to return the EV of an image, click on the main viewport, and then press s, this opens the viewer’s properties. Now set the center f-stop to 0 in there. And the SpotMeter in the viewport will change from aperture and fstops to EV.
-
Akiyoshi Kitaoka – Surround biased illumination perception
Read more: Akiyoshi Kitaoka – Surround biased illumination perceptionhttps://x.com/AkiyoshiKitaoka/status/1798705648001327209
The left face appears whitish and the right one blackish, but they are made up of the same luminance.

https://community.wolfram.com/groups/-/m/t/3191015
Illusory staircase Gelb effect
https://www.psy.ritsumei.ac.jp/akitaoka/illgelbe.html
-
Light and Matter : The 2018 theory of Physically-Based Rendering and Shading by Allegorithmic
Read more: Light and Matter : The 2018 theory of Physically-Based Rendering and Shading by Allegorithmicacademy.substance3d.com/courses/the-pbr-guide-part-1
academy.substance3d.com/courses/the-pbr-guide-part-2

 Local copy:


![[gamma correction test]](http://www.madore.org/~david/misc/color/gammatest.png "sRGB gamma correction test")


LIGHTING
-
Custom bokeh in a raytraced DOF render
Read more: Custom bokeh in a raytraced DOF render

To achieve a custom pinhole camera effect with a custom bokeh in Arnold Raytracer, you can follow these steps:
- Set the render camera with a focal length around 50 (or as needed)
- Set the F-Stop to a high value (e.g., 22).
- Set the focus distance as you require
- Turn on DOF
- Place a plane a few cm in front of the camera.
- Texture the plane with a transparent shape at the center of it. (Transmission with no specular roughness)
-
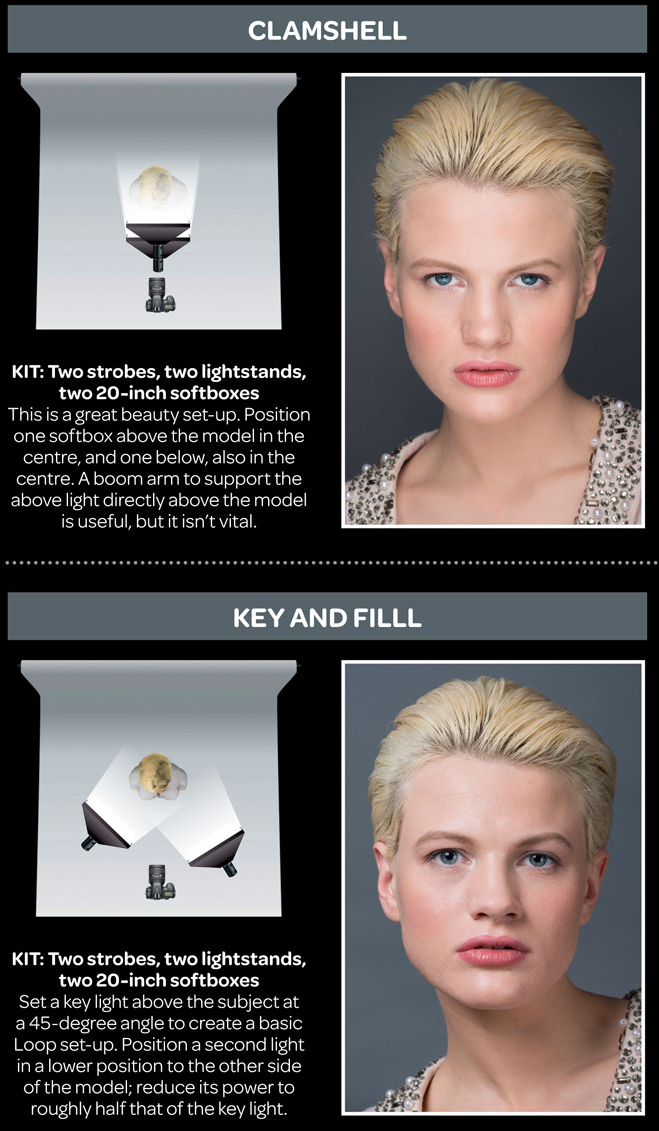
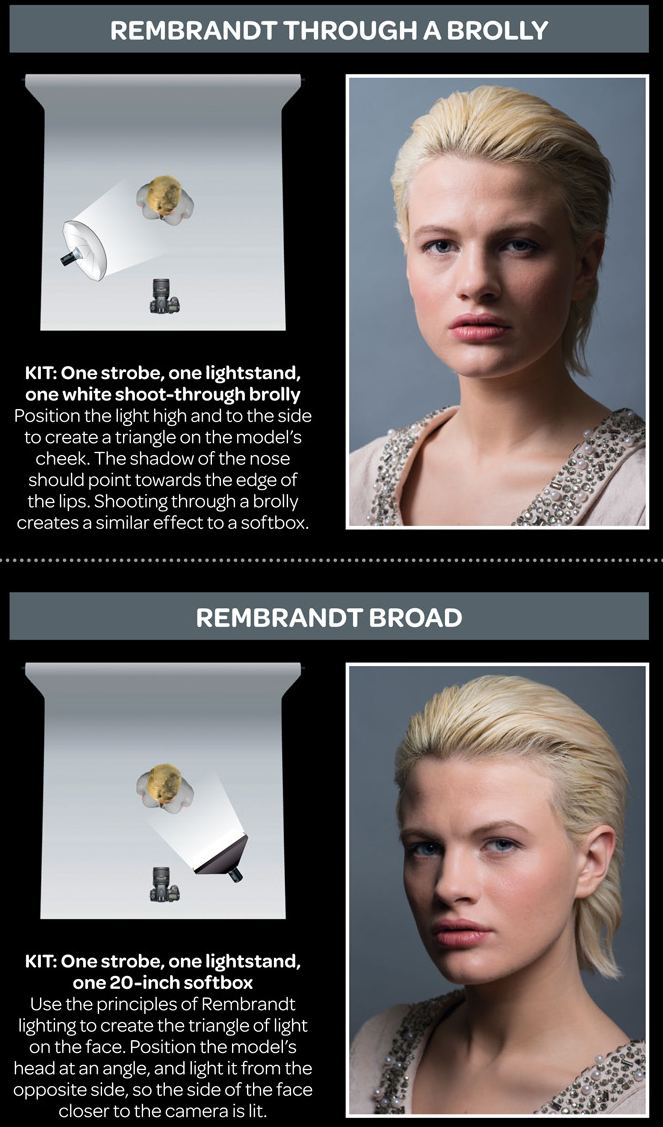
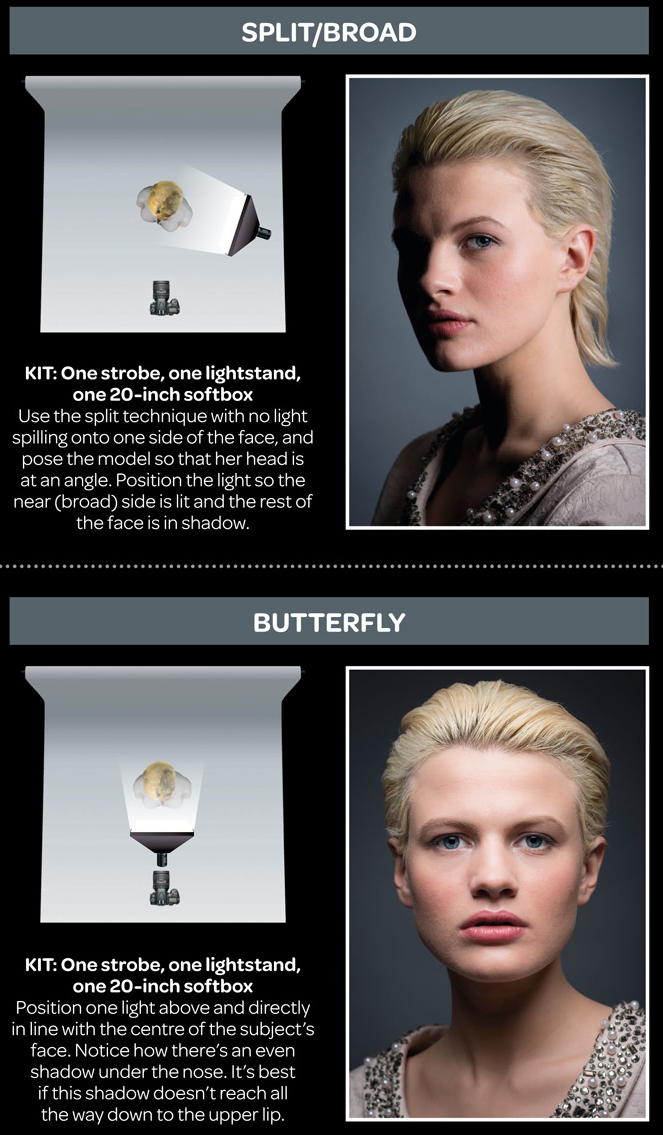
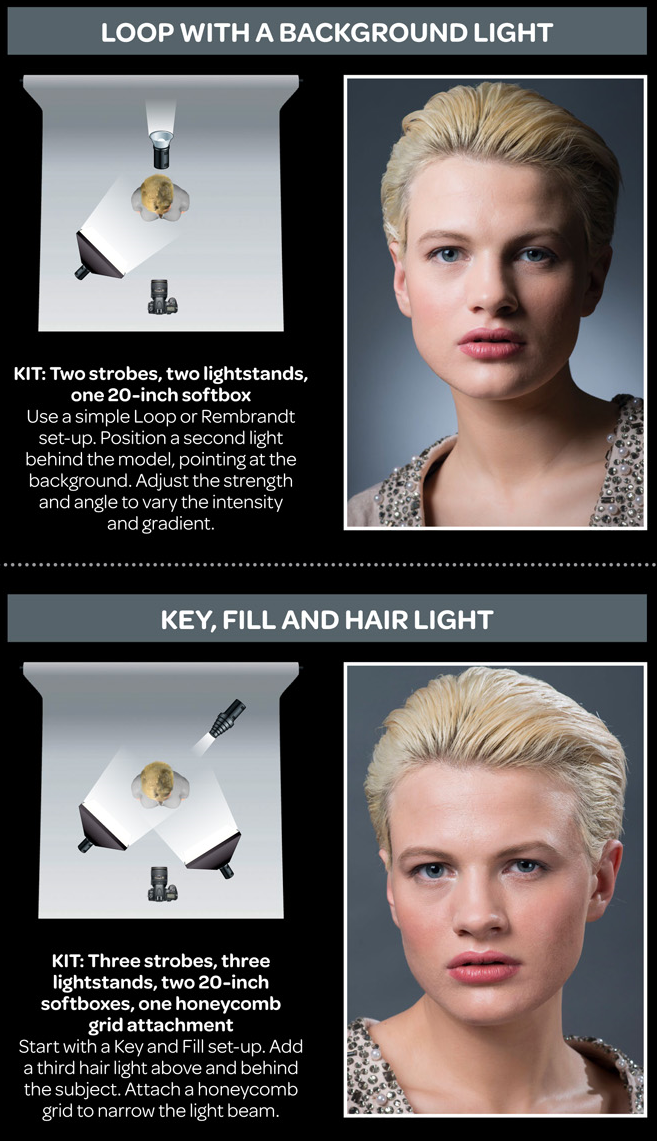
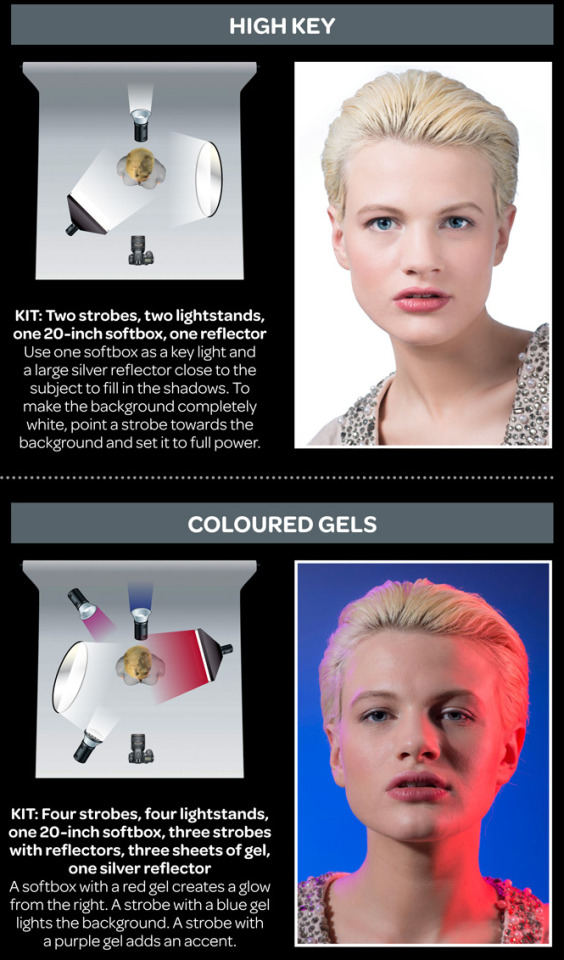
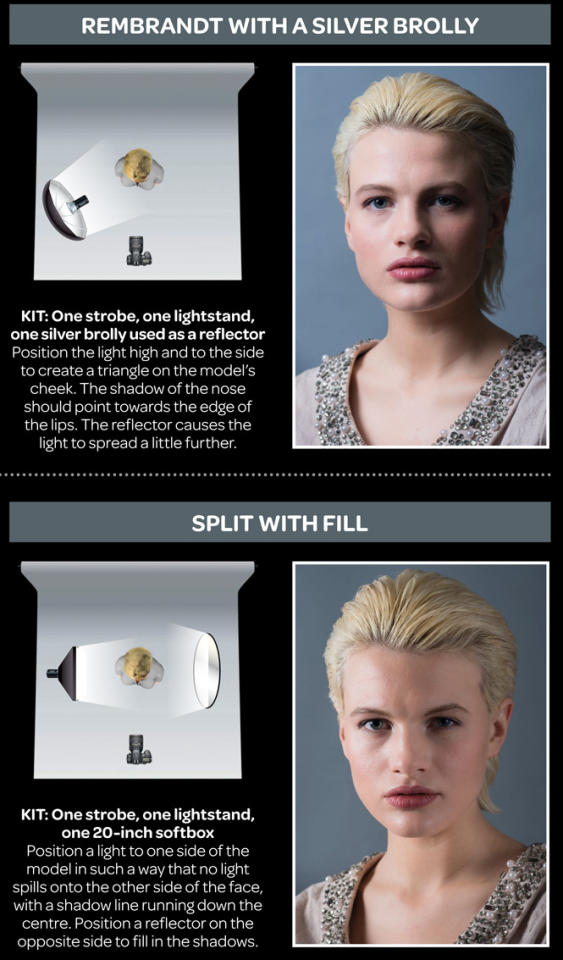
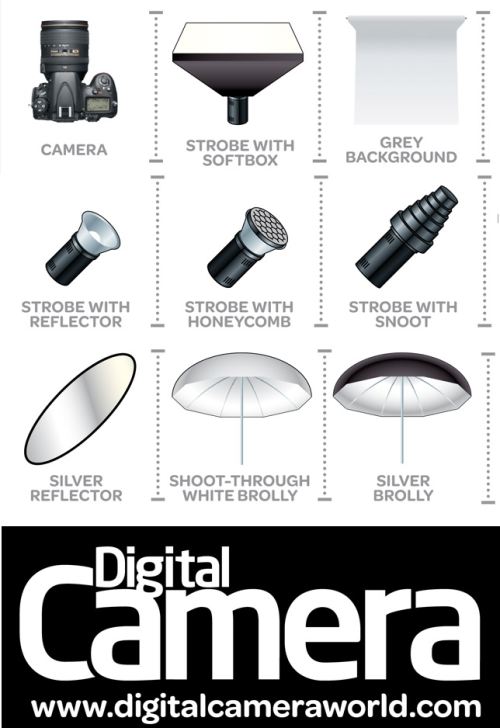
Key/Fill ratios and scene composition using false colors
Read more: Key/Fill ratios and scene composition using false colors

To measure the contrast ratio you will need a light meter. The process starts with you measuring the main source of light, or the key light.
Get a reading from the brightest area on the face of your subject. Then, measure the area lit by the secondary light, or fill light. To make sense of what you have just measured you have to understand that the information you have just gathered is in F-stops, a measure of light. With each additional F-stop, for example going one stop from f/1.4 to f/2.0, you create a doubling of light. The reverse is also true; moving one stop from f/8.0 to f/5.6 results in a halving of the light.
Let’s say you grabbed a measurement from your key light of f/8.0. Then, when you measured your fill light area, you get a reading of f/4.0. This will lead you to a contrast ratio of 4:1 because there are two stops between f/4.0 and f/8.0 and each stop doubles the amount of light. In other words, two stops x twice the light per stop = four times as much light at f/8.0 than at f/4.0.

theslantedlens.com/2017/lighting-ratios-photo-video/
Examples in the post
-
Free HDRI libraries
Read more: Free HDRI librariesnoahwitchell.com
http://www.noahwitchell.com/freebieslocationtextures.com
https://locationtextures.com/panoramas/maxroz.com
https://www.maxroz.com/hdri/listHDRI Haven
https://hdrihaven.com/Poly Haven
https://polyhaven.com/hdrisDomeble
https://www.domeble.com/IHDRI
https://www.ihdri.com/HDRMaps
https://hdrmaps.com/NoEmotionHdrs.net
http://noemotionhdrs.net/hdrday.htmlOpenFootage.net
https://www.openfootage.net/hdri-panorama/HDRI-hub
https://www.hdri-hub.com/hdrishop/hdri.zwischendrin
https://www.zwischendrin.com/en/browse/hdriLonger list here:
https://cgtricks.com/list-sites-free-hdri/

-
LUX vs LUMEN vs NITS vs CANDELA – What is the difference
Read more: LUX vs LUMEN vs NITS vs CANDELA – What is the differenceMore details here: Lumens vs Candelas (candle) vs Lux vs FootCandle vs Watts vs Irradiance vs Illuminance


https://www.inhouseav.com.au/blog/beginners-guide-nits-lumens-brightness/

Candela
Candela is the basic unit of measure of the entire volume of light intensity from any point in a single direction from a light source. Note the detail: it measures the total volume of light within a certain beam angle and direction.
While the luminance of starlight is around 0.001 cd/m2, that of a sunlit scene is around 100,000 cd/m2, which is a hundred millions times higher. The luminance of the sun itself is approximately 1,000,000,000 cd/m2.NIT
https://en.wikipedia.org/wiki/Candela_per_square_metre
The candela per square metre (symbol: cd/m2) is the unit of luminance in the International System of Units (SI). The unit is based on the candela, the SI unit of luminous intensity, and the square metre, the SI unit of area. The nit (symbol: nt) is a non-SI name also used for this unit (1 nt = 1 cd/m2).[1] The term nit is believed to come from the Latin word nitēre, “to shine”. As a measure of light emitted per unit area, this unit is frequently used to specify the brightness of a display device.
NIT and cd/m2 (candela power) represent the same thing and can be used interchangeably. One nit is equivalent to one candela per square meter, where the candela is the amount of light which has been emitted by a common tallow candle, but NIT is not part of the International System of Units (abbreviated SI, from Systeme International, in French).
It’s easiest to think of a TV as emitting light directly, in much the same way as the Sun does. Nits are simply the measurement of the level of light (luminance) in a given area which the emitting source sends to your eyes or a camera sensor.
The Nit can be considered a unit of visible-light intensity which is often used to specify the brightness level of an LCD.
1 Nit is approximately equal to 3.426 Lumens. To work out a comparable number of Nits to Lumens, you need to multiply the number of Nits by 3.426. If you know the number of Lumens, and wish to know the Nits, simply divide the number of Lumens by 3.426.
Most consumer desktop LCDs have Nits of 200 to 300, the average TV most likely has an output capability of between 100 and 200 Nits, and an HDR TV ranges from 400 to 1,500 Nits.
Virtual Production sets currently sport around 6000 NIT ceiling and 1000 NIT wall panels.The ambient brightness of a sunny day with clear blue skies is between 7000-10,000 nits (between 3000-7000 nits for overcast skies and indirect sunlight).
A bright sunny day can have specular highlights that reach over 100,000 nits. Direct sunlight is around 1,600,000,000 nits.
10,000 nits is also the typical brightness of a fluorescent tube – bright, but not painful to look at.
https://www.displaydaily.com/article/display-daily/dolby-vision-vs-hdr10-clarified
Tests showed that a “black level” of 0.005 nits (cd/m²) satisfied the vast majority of viewers. While 0.005 nits is very close to true black, Griffis says Dolby can go down to a black of 0.0001 nits, even though there is no need or ability for displays to get that dark today.
How bright is white? Dolby says the range of 0.005 nits – 10,000 nits satisfied 84% of the viewers in their viewing tests.
The brightest consumer HDR displays today are about 1,500 nits. Professional displays where HDR content is color-graded can achieve up to 4,000 nits peak brightness.High brightness that would be in danger of damaging the eye would be in the neighborhood of 250,000 nits.
Lumens
Lumen is a measure of how much light is emitted (luminance, luminous flux) by an object. It indicates the total potential amount of light from a light source that is visible to the human eye.
Lumen is commonly used in the context of light bulbs or video-projectors as a metric for their brightness power.Lumen is used to describe light output, and about video projectors, it is commonly referred to as ANSI Lumens. Simply put, lumens is how to find out how bright a LED display is. The higher the lumens, the brighter to display!
Technically speaking, a Lumen is the SI unit of luminous flux, which is equal to the amount of light which is emitted per second in a unit solid angle of one steradian from a uniform source of one-candela intensity radiating in all directions.
LUX
Lux (lx) or often Illuminance, is a photometric unit along a given area, which takes in account the sensitivity of human eye to different wavelenghts. It is the measure of light at a specific distance within a specific area at that distance. Often used to measure the incidental sun’s intensity.
-
Neural Microfacet Fields for Inverse Rendering
Read more: Neural Microfacet Fields for Inverse Renderinghttps://half-potato.gitlab.io/posts/nmf/


COLLECTIONS
| Featured AI
| Design And Composition
| Explore posts
POPULAR SEARCHES
unreal | pipeline | virtual production | free | learn | photoshop | 360 | macro | google | nvidia | resolution | open source | hdri | real-time | photography basics | nuke
FEATURED POSTS
-
Free fonts
-
Photography basics: Exposure Value vs Photographic Exposure vs Il/Luminance vs Pixel luminance measurements
-
Convert 2D Images or Text to 3D Models
-
Guide to Prompt Engineering
-
What Is The Resolution and view coverage Of The human Eye. And what distance is TV at best?
-
Web vs Printing or digital RGB vs CMYK
-
How to paint a boardgame miniatures
-
MiniMax-Remover – Taming Bad Noise Helps Video Object Removal Rotoscoping
Social Links
DISCLAIMER – Links and images on this website may be protected by the respective owners’ copyright. All data submitted by users through this site shall be treated as freely available to share.
