


COMPOSITION
DESIGN
-
Reuben Wu – Glowing Geometric Light Paintings
Read more: Reuben Wu – Glowing Geometric Light Paintingswww.thisiscolossal.com/2021/04/reuben-wu-ex-stasis/

Wu programmed a stick of 200 LED lights to shift in color and shape above the calm landscapes. He captured the mesmerizing movements in-camera, and through a combination of stills, timelapse, and real-time footage, produced four audiovisual works that juxtapose the natural scenery with the artificially produced light and electronic sounds.


COLOR
-
mmColorTarget – Nuke Gizmo for color matching a MacBeth chart
Read more: mmColorTarget – Nuke Gizmo for color matching a MacBeth charthttps://www.marcomeyer-vfx.de/posts/2014-04-11-mmcolortarget-nuke-gizmo/
https://www.marcomeyer-vfx.de/posts/mmcolortarget-nuke-gizmo/
https://vimeo.com/9.1652466e+07
https://www.nukepedia.com/gizmos/colour/mmcolortarget
-
OLED vs QLED – What TV is better?
Read more: OLED vs QLED – What TV is better?
Supported by LG, Philips, Panasonic and Sony sell the OLED system TVs.
OLED stands for “organic light emitting diode.”
It is a fundamentally different technology from LCD, the major type of TV today.
OLED is “emissive,” meaning the pixels emit their own light.Samsung is branding its best TVs with a new acronym: “QLED”
QLED (according to Samsung) stands for “quantum dot LED TV.”
It is a variation of the common LED LCD, adding a quantum dot film to the LCD “sandwich.”
QLED, like LCD, is, in its current form, “transmissive” and relies on an LED backlight.OLED is the only technology capable of absolute blacks and extremely bright whites on a per-pixel basis. LCD definitely can’t do that, and even the vaunted, beloved, dearly departed plasma couldn’t do absolute blacks.
QLED, as an improvement over OLED, significantly improves the picture quality. QLED can produce an even wider range of colors than OLED, which says something about this new tech. QLED is also known to produce up to 40% higher luminance efficiency than OLED technology. Further, many tests conclude that QLED is far more efficient in terms of power consumption than its predecessor, OLED.

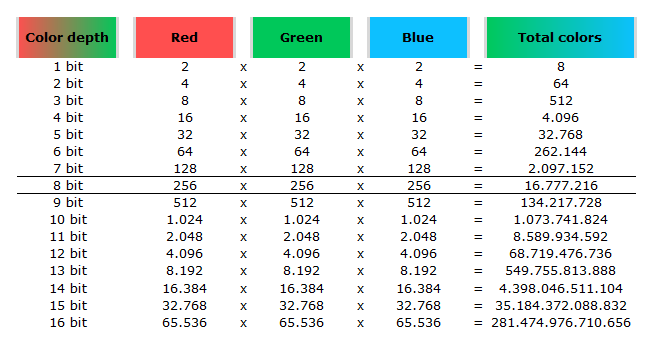
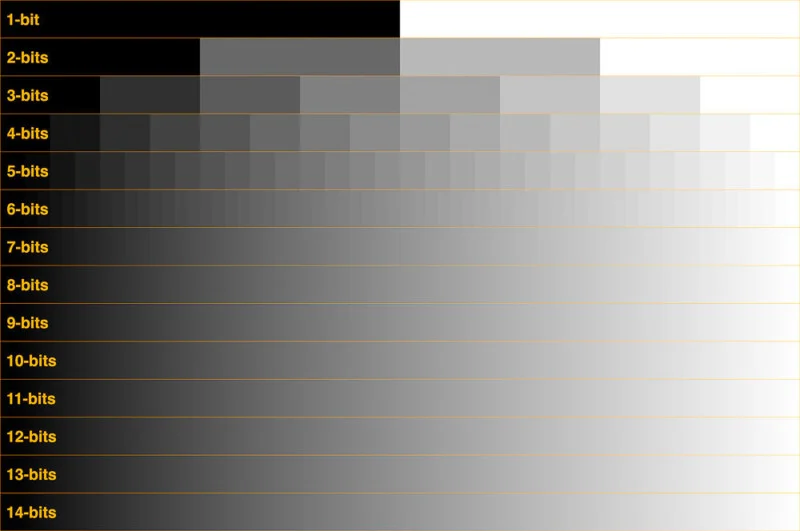
When analyzing TVs color, it may be beneficial to consider at least 3 elements:
“Color Depth”, “Color Gamut”, and “Dynamic Range”.Color Depth (or “Bit-Depth”, e.g. 8-bit, 10-bit, 12-bit) determines how many distinct color variations (tones/shades) can be viewed on a given display.
Color Gamut (e.g. WCG) determines which specific colors can be displayed from a given “Color Space” (Rec.709, Rec.2020, DCI-P3) (i.e. the color range).
Dynamic Range (SDR, HDR) determines the luminosity range of a specific color – from its darkest shade (or tone) to its brightest.
The overall brightness range of a color will be determined by a display’s “contrast ratio”, that is, the ratio of luminance between the darkest black that can be produced and the brightest white.
Color Volume is the “Color Gamut” + the “Dynamic/Luminosity Range”.
A TV’s Color Volume will not only determine which specific colors can be displayed (the color range) but also that color’s luminosity range, which will have an affect on its “brightness”, and “colorfulness” (intensity and saturation).The better the colour volume in a TV, the closer to life the colours appear.
QLED TV can express nearly all of the colours in the DCI-P3 colour space, and of those colours, express 100% of the colour volume, thereby producing an incredible range of colours.
With OLED TV, when the image is too bright, the percentage of the colours in the colour volume produced by the TV drops significantly. The colours get washed out and can only express around 70% colour volume, making the picture quality drop too.
Note. OLED TV uses organic material, so it may lose colour expression as it ages.
Resources for more reading and comparison below
www.avsforum.com/forum/166-lcd-flat-panel-displays/2812161-what-color-volume.html
www.newtechnologytv.com/qled-vs-oled/
news.samsung.com/za/qled-tv-vs-oled-tv
www.cnet.com/news/qled-vs-oled-samsungs-tv-tech-and-lgs-tv-tech-are-not-the-same/

-
The 7 key elements of brand identity design + 10 corporate identity examples
Read more: The 7 key elements of brand identity design + 10 corporate identity exampleswww.lucidpress.com/blog/the-7-key-elements-of-brand-identity-design
1. Clear brand purpose and positioning
2. Thorough market research
3. Likable brand personality
4. Memorable logo
5. Attractive color palette
6. Professional typography
7. On-brand supporting graphics

-
Photography Basics : Spectral Sensitivity Estimation Without a Camera
Read more: Photography Basics : Spectral Sensitivity Estimation Without a Camerahttps://color-lab-eilat.github.io/Spectral-sensitivity-estimation-web/
A number of problems in computer vision and related fields would be mitigated if camera spectral sensitivities were known. As consumer cameras are not designed for high-precision visual tasks, manufacturers do not disclose spectral sensitivities. Their estimation requires a costly optical setup, which triggered researchers to come up with numerous indirect methods that aim to lower cost and complexity by using color targets. However, the use of color targets gives rise to new complications that make the estimation more difficult, and consequently, there currently exists no simple, low-cost, robust go-to method for spectral sensitivity estimation that non-specialized research labs can adopt. Furthermore, even if not limited by hardware or cost, researchers frequently work with imagery from multiple cameras that they do not have in their possession.
To provide a practical solution to this problem, we propose a framework for spectral sensitivity estimation that not only does not require any hardware (including a color target), but also does not require physical access to the camera itself. Similar to other work, we formulate an optimization problem that minimizes a two-term objective function: a camera-specific term from a system of equations, and a universal term that bounds the solution space.
Different than other work, we utilize publicly available high-quality calibration data to construct both terms. We use the colorimetric mapping matrices provided by the Adobe DNG Converter to formulate the camera-specific system of equations, and constrain the solutions using an autoencoder trained on a database of ground-truth curves. On average, we achieve reconstruction errors as low as those that can arise due to manufacturing imperfections between two copies of the same camera. We provide predicted sensitivities for more than 1,000 cameras that the Adobe DNG Converter currently supports, and discuss which tasks can become trivial when camera responses are available.


-
Practical Aspects of Spectral Data and LEDs in Digital Content Production and Virtual Production – SIGGRAPH 2022
Read more: Practical Aspects of Spectral Data and LEDs in Digital Content Production and Virtual Production – SIGGRAPH 2022
Comparison to the commercial side

https://www.ecolorled.com/blog/detail/what-is-rgb-rgbw-rgbic-strip-lights
RGBW (RGB + White) LED strip uses a 4-in-1 LED chip made up of red, green, blue, and white.
RGBWW (RGB + White + Warm White) LED strip uses either a 5-in-1 LED chip with red, green, blue, white, and warm white for color mixing. The only difference between RGBW and RGBWW is the intensity of the white color. The term RGBCCT consists of RGB and CCT. CCT (Correlated Color Temperature) means that the color temperature of the led strip light can be adjusted to change between warm white and white. Thus, RGBWW strip light is another name of RGBCCT strip.
RGBCW is the acronym for Red, Green, Blue, Cold, and Warm. These 5-in-1 chips are used in supper bright smart LED lighting products
-
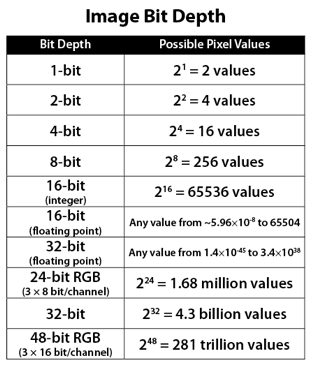
Image rendering bit depth
Read more: Image rendering bit depthThe terms 8-bit, 16-bit, 16-bit float, and 32-bit refer to different data formats used to store and represent image information, as bits per pixel.
https://en.wikipedia.org/wiki/Color_depth
In color technology, color depth also known as bit depth, is either the number of bits used to indicate the color of a single pixel, OR the number of bits used for each color component of a single pixel.
When referring to a pixel, the concept can be defined as bits per pixel (bpp).
When referring to a color component, the concept can be defined as bits per component, bits per channel, bits per color (all three abbreviated bpc), and also bits per pixel component, bits per color channel or bits per sample (bps). Modern standards tend to use bits per component, but historical lower-depth systems used bits per pixel more often.
Color depth is only one aspect of color representation, expressing the precision with which the amount of each primary can be expressed; the other aspect is how broad a range of colors can be expressed (the gamut). The definition of both color precision and gamut is accomplished with a color encoding specification which assigns a digital code value to a location in a color space.

Here’s a simple explanation of each.
8-bit images (i.e. 24 bits per pixel for a color image) are considered Low Dynamic Range.
They can store around 5 stops of light and each pixel carry a value from 0 (black) to 255 (white).
As a comparison, DSLR cameras can capture ~12-15 stops of light and they use RAW files to store the information.16-bit: This format is commonly referred to as “half-precision.” It uses 16 bits of data to represent color values for each pixel. With 16 bits, you can have 65,536 discrete levels of color, allowing for relatively high precision and smooth gradients. However, it has a limited dynamic range, meaning it cannot accurately represent extremely bright or dark values. It is commonly used for regular images and textures.
16-bit float: This format is an extension of the 16-bit format but uses floating-point numbers instead of fixed integers. Floating-point numbers allow for more precise calculations and a larger dynamic range. In this case, the 16 bits are used to store both the color value and the exponent, which controls the range of values that can be represented. The 16-bit float format provides better accuracy and a wider dynamic range than regular 16-bit, making it useful for high-dynamic-range imaging (HDRI) and computations that require more precision.
32-bit: (i.e. 96 bits per pixel for a color image) are considered High Dynamic Range. This format, also known as “full-precision” or “float,” uses 32 bits to represent color values and offers the highest precision and dynamic range among the three options. With 32 bits, you have a significantly larger number of discrete levels, allowing for extremely accurate color representation, smooth gradients, and a wide range of brightness values. It is commonly used for professional rendering, visual effects, and scientific applications where maximum precision is required.
Bits and HDR coverage
High Dynamic Range (HDR) images are designed to capture a wide range of luminance values, from the darkest shadows to the brightest highlights, in order to reproduce a scene with more accuracy and detail. The bit depth of an image refers to the number of bits used to represent each pixel’s color information. When comparing 32-bit float and 16-bit float HDR images, the drop in accuracy primarily relates to the precision of the color information.
A 32-bit float HDR image offers a higher level of precision compared to a 16-bit float HDR image. In a 32-bit float format, each color channel (red, green, and blue) is represented by 32 bits, allowing for a larger range of values to be stored. This increased precision enables the image to retain more details and subtleties in color and luminance.
On the other hand, a 16-bit float HDR image utilizes 16 bits per color channel, resulting in a reduced range of values that can be represented. This lower precision leads to a loss of fine details and color nuances, especially in highly contrasted areas of the image where there are significant differences in luminance.
The drop in accuracy between 32-bit and 16-bit float HDR images becomes more noticeable as the exposure range of the scene increases. Exposure range refers to the span between the darkest and brightest areas of an image. In scenes with a limited exposure range, where the luminance differences are relatively small, the loss of accuracy may not be as prominent or perceptible. These images usually are around 8-10 exposure levels.
However, in scenes with a wide exposure range, such as a landscape with deep shadows and bright highlights, the reduced precision of a 16-bit float HDR image can result in visible artifacts like color banding, posterization, and loss of detail in both shadows and highlights. The image may exhibit abrupt transitions between tones or colors, which can appear unnatural and less realistic.
To provide a rough estimate, it is often observed that exposure values beyond approximately ±6 to ±8 stops from the middle gray (18% reflectance) may be more prone to accuracy issues in a 16-bit float format. This range may vary depending on the specific implementation and encoding scheme used.
To summarize, the drop in accuracy between 32-bit and 16-bit float HDR images is mainly related to the reduced precision of color information. This decrease in precision becomes more apparent in scenes with a wide exposure range, affecting the representation of fine details and leading to visible artifacts in the image.
In practice, this means that exposure values beyond a certain range will experience a loss of accuracy and detail when stored in a 16-bit float format. The exact range at which this loss occurs depends on the encoding scheme and the specific implementation. However, in general, extremely bright or extremely dark values that fall outside the representable range may be subject to quantization errors, resulting in loss of detail, banding, or other artifacts.
HDRs used for lighting purposes are usually slightly convolved to improve on sampling speed and removing specular artefacts. To that extent, 16 bit float HDRIs tend to me most used in CG cycles.


LIGHTING
-
Key/Fill ratios and scene composition using false colors
Read more: Key/Fill ratios and scene composition using false colors

To measure the contrast ratio you will need a light meter. The process starts with you measuring the main source of light, or the key light.
Get a reading from the brightest area on the face of your subject. Then, measure the area lit by the secondary light, or fill light. To make sense of what you have just measured you have to understand that the information you have just gathered is in F-stops, a measure of light. With each additional F-stop, for example going one stop from f/1.4 to f/2.0, you create a doubling of light. The reverse is also true; moving one stop from f/8.0 to f/5.6 results in a halving of the light.
Let’s say you grabbed a measurement from your key light of f/8.0. Then, when you measured your fill light area, you get a reading of f/4.0. This will lead you to a contrast ratio of 4:1 because there are two stops between f/4.0 and f/8.0 and each stop doubles the amount of light. In other words, two stops x twice the light per stop = four times as much light at f/8.0 than at f/4.0.

theslantedlens.com/2017/lighting-ratios-photo-video/
Examples in the post
-
Photography basics: Color Temperature and White Balance
Read more: Photography basics: Color Temperature and White Balance

Color Temperature of a light source describes the spectrum of light which is radiated from a theoretical “blackbody” (an ideal physical body that absorbs all radiation and incident light – neither reflecting it nor allowing it to pass through) with a given surface temperature.
https://en.wikipedia.org/wiki/Color_temperature
Or. Most simply it is a method of describing the color characteristics of light through a numerical value that corresponds to the color emitted by a light source, measured in degrees of Kelvin (K) on a scale from 1,000 to 10,000.
More accurately. The color temperature of a light source is the temperature of an ideal backbody that radiates light of comparable hue to that of the light source.
As such, the color temperature of a light source is a numerical measurement of its color appearance. It is based on the principle that any object will emit light if it is heated to a high enough temperature, and that the color of that light will shift in a predictable manner as the temperature is increased. The system is based on the color changes of a theoretical “blackbody radiator” as it is heated from a cold black to a white hot state.
So, why do we measure the hue of the light as a “temperature”? This was started in the late 1800s, when the British physicist William Kelvin heated a block of carbon. It glowed in the heat, producing a range of different colors at different temperatures. The black cube first produced a dim red light, increasing to a brighter yellow as the temperature went up, and eventually produced a bright blue-white glow at the highest temperatures. In his honor, Color Temperatures are measured in degrees Kelvin, which are a variation on Centigrade degrees. Instead of starting at the temperature water freezes, the Kelvin scale starts at “absolute zero,” which is -273 Centigrade.
More about black bodies here: https://www.pixelsham.com/2013/03/14/black-body-color

Details in the post
-
HDRI Median Cut plugin
Read more: HDRI Median Cut pluginwww.hdrlabs.com/picturenaut/plugins.html

Note. The Median Cut algorithm is typically used for color quantization, which involves reducing the number of colors in an image while preserving its visual quality. It doesn’t directly provide a way to identify the brightest areas in an image. However, if you’re interested in identifying the brightest areas, you might want to look into other methods like thresholding, histogram analysis, or edge detection, through openCV for example.
Here is an openCV example:
# bottom left coordinates = 0,0 import numpy as np import cv2 # Load the HDR or EXR image image = cv2.imread('your_image_path.exr', cv2.IMREAD_UNCHANGED) # Load as-is without modification # Calculate the luminance from the HDR channels (assuming RGB format) luminance = np.dot(image[..., :3], [0.299, 0.587, 0.114]) # Set a threshold value based on estimated EV threshold_value = 2.4 # Estimated threshold value based on 4.8 EV # Apply the threshold to identify bright areas # Theluminancearray contains the calculated luminance values for each pixel in the image. # Thethreshold_valueis a user-defined value that represents a cutoff point, separating "bright" and "dark" areas in terms of perceived luminance.thresholded = (luminance > threshold_value) * 255 # Convert the thresholded image to uint8 for contour detection thresholded = thresholded.astype(np.uint8) # Find contours of the bright areas contours, _ = cv2.findContours(thresholded, cv2.RETR_EXTERNAL, cv2.CHAIN_APPROX_SIMPLE) # Create a list to store the bounding boxes of bright areas bright_areas = [] # Iterate through contours and extract bounding boxes for contour in contours: x, y, w, h = cv2.boundingRect(contour) # Adjust y-coordinate based on bottom-left origin y_bottom_left_origin = image.shape[0] - (y + h) bright_areas.append((x, y_bottom_left_origin, x + w, y_bottom_left_origin + h)) # Store as (x1, y1, x2, y2) # Print the identified bright areas print("Bright Areas (x1, y1, x2, y2):") for area in bright_areas: print(area)More details
Luminance and Exposure in an EXR Image:
- An EXR (Extended Dynamic Range) image format is often used to store high dynamic range (HDR) images that contain a wide range of luminance values, capturing both dark and bright areas.
- Luminance refers to the perceived brightness of a pixel in an image. In an RGB image, luminance is often calculated using a weighted sum of the red, green, and blue channels, where different weights are assigned to each channel to account for human perception.
- In an EXR image, the pixel values can represent radiometrically accurate scene values, including actual radiance or irradiance levels. These values are directly related to the amount of light emitted or reflected by objects in the scene.
The luminance line is calculating the luminance of each pixel in the image using a weighted sum of the red, green, and blue channels. The three float values [0.299, 0.587, 0.114] are the weights used to perform this calculation.
These weights are based on the concept of luminosity, which aims to approximate the perceived brightness of a color by taking into account the human eye’s sensitivity to different colors. The values are often derived from the NTSC (National Television System Committee) standard, which is used in various color image processing operations.
Here’s the breakdown of the float values:
- 0.299: Weight for the red channel.
- 0.587: Weight for the green channel.
- 0.114: Weight for the blue channel.
The weighted sum of these channels helps create a grayscale image where the pixel values represent the perceived brightness. This technique is often used when converting a color image to grayscale or when calculating luminance for certain operations, as it takes into account the human eye’s sensitivity to different colors.
For the threshold, remember that the exact relationship between EV values and pixel values can depend on the tone-mapping or normalization applied to the HDR image, as well as the dynamic range of the image itself.
To establish a relationship between exposure and the threshold value, you can consider the relationship between linear and logarithmic scales:
- Linear and Logarithmic Scales:
- Exposure values in an EXR image are often represented in logarithmic scales, such as EV (exposure value). Each increment in EV represents a doubling or halving of the amount of light captured.
- Threshold values for luminance thresholding are usually linear, representing an actual luminance level.
- Conversion Between Scales:
- To establish a mathematical relationship, you need to convert between the logarithmic exposure scale and the linear threshold scale.
- One common method is to use a power function. For instance, you can use a power function to convert EV to a linear intensity value.
threshold_value = base_value * (2 ** EV)Here,
EVis the exposure value,base_valueis a scaling factor that determines the relationship between EV and threshold_value, and2 ** EVis used to convert the logarithmic EV to a linear intensity value. - Choosing the Base Value:
- The
base_valuefactor should be determined based on the dynamic range of your EXR image and the specific luminance values you are dealing with. - You may need to experiment with different values of
base_valueto achieve the desired separation of bright areas from the rest of the image.
- The
Let’s say you have an EXR image with a dynamic range of 12 EV, which is a common range for many high dynamic range images. In this case, you want to set a threshold value that corresponds to a certain number of EV above the middle gray level (which is often considered to be around 0.18).
Here’s an example of how you might determine a
base_valueto achieve this:# Define the dynamic range of the image in EV dynamic_range = 12 # Choose the desired number of EV above middle gray for thresholding desired_ev_above_middle_gray = 2 # Calculate the threshold value based on the desired EV above middle gray threshold_value = 0.18 * (2 ** (desired_ev_above_middle_gray / dynamic_range)) print("Threshold Value:", threshold_value) -
domeble – Hi-Resolution CGI Backplates and 360° HDRI
Read more: domeble – Hi-Resolution CGI Backplates and 360° HDRIWhen collecting hdri make sure the data supports basic metadata, such as:
- Iso
- Aperture
- Exposure time or shutter time
- Color temperature
- Color space Exposure value (what the sensor receives of the sun intensity in lux)
- 7+ brackets (with 5 or 6 being the perceived balanced exposure)
In image processing, computer graphics, and photography, high dynamic range imaging (HDRI or just HDR) is a set of techniques that allow a greater dynamic range of luminances (a Photometry measure of the luminous intensity per unit area of light travelling in a given direction. It describes the amount of light that passes through or is emitted from a particular area, and falls within a given solid angle) between the lightest and darkest areas of an image than standard digital imaging techniques or photographic methods. This wider dynamic range allows HDR images to represent more accurately the wide range of intensity levels found in real scenes ranging from direct sunlight to faint starlight and to the deepest shadows.
The two main sources of HDR imagery are computer renderings and merging of multiple photographs, which in turn are known as low dynamic range (LDR) or standard dynamic range (SDR) images. Tone Mapping (Look-up) techniques, which reduce overall contrast to facilitate display of HDR images on devices with lower dynamic range, can be applied to produce images with preserved or exaggerated local contrast for artistic effect. Photography
In photography, dynamic range is measured in Exposure Values (in photography, exposure value denotes all combinations of camera shutter speed and relative aperture that give the same exposure. The concept was developed in Germany in the 1950s) differences or stops, between the brightest and darkest parts of the image that show detail. An increase of one EV or one stop is a doubling of the amount of light.
The human response to brightness is well approximated by a Steven’s power law, which over a reasonable range is close to logarithmic, as described by the Weber�Fechner law, which is one reason that logarithmic measures of light intensity are often used as well.
HDR is short for High Dynamic Range. It’s a term used to describe an image which contains a greater exposure range than the “black” to “white” that 8 or 16-bit integer formats (JPEG, TIFF, PNG) can describe. Whereas these Low Dynamic Range images (LDR) can hold perhaps 8 to 10 f-stops of image information, HDR images can describe beyond 30 stops and stored in 32 bit images.


COLLECTIONS
| Featured AI
| Design And Composition
| Explore posts
POPULAR SEARCHES
unreal | pipeline | virtual production | free | learn | photoshop | 360 | macro | google | nvidia | resolution | open source | hdri | real-time | photography basics | nuke
FEATURED POSTS
Social Links
DISCLAIMER – Links and images on this website may be protected by the respective owners’ copyright. All data submitted by users through this site shall be treated as freely available to share.
