


COMPOSITION
-
Key/Fill ratios and scene composition using false colors
Read more: Key/Fill ratios and scene composition using false colors

To measure the contrast ratio you will need a light meter. The process starts with you measuring the main source of light, or the key light.
Get a reading from the brightest area on the face of your subject. Then, measure the area lit by the secondary light, or fill light. To make sense of what you have just measured you have to understand that the information you have just gathered is in F-stops, a measure of light. With each additional F-stop, for example going one stop from f/1.4 to f/2.0, you create a doubling of light. The reverse is also true; moving one stop from f/8.0 to f/5.6 results in a halving of the light.
Let’s say you grabbed a measurement from your key light of f/8.0. Then, when you measured your fill light area, you get a reading of f/4.0. This will lead you to a contrast ratio of 4:1 because there are two stops between f/4.0 and f/8.0 and each stop doubles the amount of light. In other words, two stops x twice the light per stop = four times as much light at f/8.0 than at f/4.0.

theslantedlens.com/2017/lighting-ratios-photo-video/
Examples in the post


DESIGN
-
How to paint a boardgame miniatures
Read more: How to paint a boardgame miniatures
Steps:
- soap wash cleaning
- primer
- base-coat layer (black/white)
- detailing
- washing aka shade (could be done after highlighting)
- highlights aka dry brushing (could be done after washing)
- varnish (gloss/satin/matte)


COLOR
-
No one could see the colour blue until modern times
Read more: No one could see the colour blue until modern timeshttps://www.businessinsider.com/what-is-blue-and-how-do-we-see-color-2015-2

The way humans see the world… until we have a way to describe something, even something so fundamental as a colour, we may not even notice that something it’s there.
Ancient languages didn’t have a word for blue — not Greek, not Chinese, not Japanese, not Hebrew, not Icelandic cultures. And without a word for the colour, there’s evidence that they may not have seen it at all.
https://www.wnycstudios.org/story/211119-colorsEvery language first had a word for black and for white, or dark and light. The next word for a colour to come into existence — in every language studied around the world — was red, the colour of blood and wine.
After red, historically, yellow appears, and later, green (though in a couple of languages, yellow and green switch places). The last of these colours to appear in every language is blue.The only ancient culture to develop a word for blue was the Egyptians — and as it happens, they were also the only culture that had a way to produce a blue dye.
https://mymodernmet.com/shades-of-blue-color-history/True blue hues are rare in the natural world because synthesizing pigments that absorb longer-wavelength light (reds and yellows) while reflecting shorter-wavelength blue light requires exceptionally elaborate molecular structures—biochemical feats that most plants and animals simply don’t undertake.
When you gaze at a blueberry’s deep blue surface, you’re actually seeing structural coloration rather than a true blue pigment. A fine, waxy bloom on the berry’s skin contains nanostructures that preferentially scatter blue and violet light, giving the fruit its signature blue sheen even though its inherent pigment is reddish.
Similarly, many of nature’s most striking blues—like those of blue jays and morpho butterflies—arise not from blue pigments but from microscopic architectures in feathers or wing scales. These tiny ridges and air pockets manipulate incoming light so that blue wavelengths emerge most prominently, creating vivid, angle-dependent colors through scattering rather than pigment alone.
(more…) -
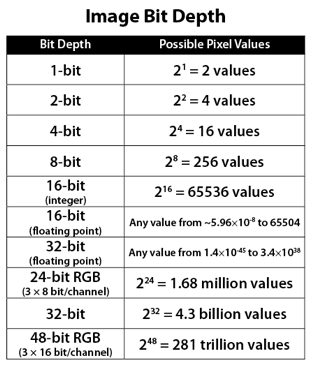
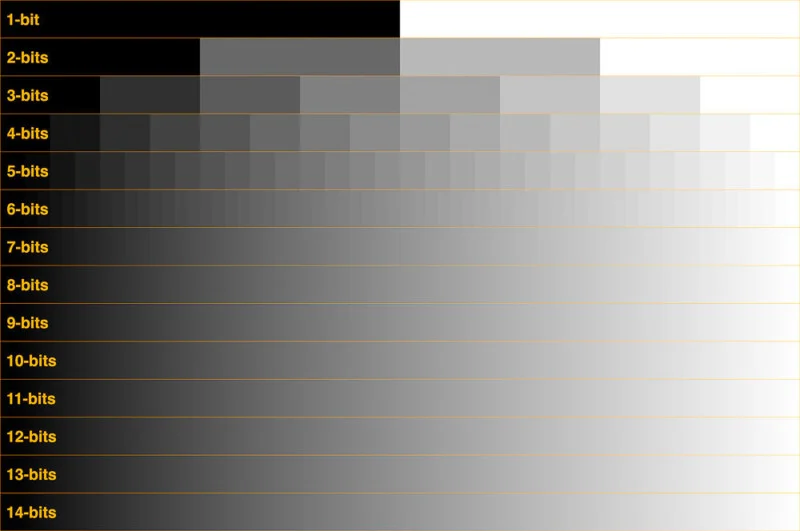
Image rendering bit depth
Read more: Image rendering bit depthThe terms 8-bit, 16-bit, 16-bit float, and 32-bit refer to different data formats used to store and represent image information, as bits per pixel.
https://en.wikipedia.org/wiki/Color_depth
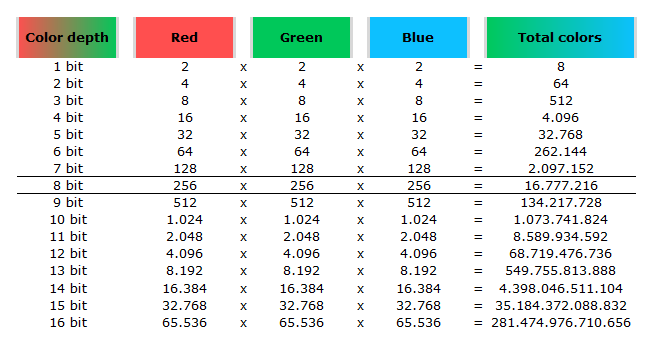
In color technology, color depth also known as bit depth, is either the number of bits used to indicate the color of a single pixel, OR the number of bits used for each color component of a single pixel.
When referring to a pixel, the concept can be defined as bits per pixel (bpp).
When referring to a color component, the concept can be defined as bits per component, bits per channel, bits per color (all three abbreviated bpc), and also bits per pixel component, bits per color channel or bits per sample (bps). Modern standards tend to use bits per component, but historical lower-depth systems used bits per pixel more often.
Color depth is only one aspect of color representation, expressing the precision with which the amount of each primary can be expressed; the other aspect is how broad a range of colors can be expressed (the gamut). The definition of both color precision and gamut is accomplished with a color encoding specification which assigns a digital code value to a location in a color space.

Here’s a simple explanation of each.
8-bit images (i.e. 24 bits per pixel for a color image) are considered Low Dynamic Range.
They can store around 5 stops of light and each pixel carry a value from 0 (black) to 255 (white).
As a comparison, DSLR cameras can capture ~12-15 stops of light and they use RAW files to store the information.16-bit: This format is commonly referred to as “half-precision.” It uses 16 bits of data to represent color values for each pixel. With 16 bits, you can have 65,536 discrete levels of color, allowing for relatively high precision and smooth gradients. However, it has a limited dynamic range, meaning it cannot accurately represent extremely bright or dark values. It is commonly used for regular images and textures.
16-bit float: This format is an extension of the 16-bit format but uses floating-point numbers instead of fixed integers. Floating-point numbers allow for more precise calculations and a larger dynamic range. In this case, the 16 bits are used to store both the color value and the exponent, which controls the range of values that can be represented. The 16-bit float format provides better accuracy and a wider dynamic range than regular 16-bit, making it useful for high-dynamic-range imaging (HDRI) and computations that require more precision.
32-bit: (i.e. 96 bits per pixel for a color image) are considered High Dynamic Range. This format, also known as “full-precision” or “float,” uses 32 bits to represent color values and offers the highest precision and dynamic range among the three options. With 32 bits, you have a significantly larger number of discrete levels, allowing for extremely accurate color representation, smooth gradients, and a wide range of brightness values. It is commonly used for professional rendering, visual effects, and scientific applications where maximum precision is required.
Bits and HDR coverage
High Dynamic Range (HDR) images are designed to capture a wide range of luminance values, from the darkest shadows to the brightest highlights, in order to reproduce a scene with more accuracy and detail. The bit depth of an image refers to the number of bits used to represent each pixel’s color information. When comparing 32-bit float and 16-bit float HDR images, the drop in accuracy primarily relates to the precision of the color information.
A 32-bit float HDR image offers a higher level of precision compared to a 16-bit float HDR image. In a 32-bit float format, each color channel (red, green, and blue) is represented by 32 bits, allowing for a larger range of values to be stored. This increased precision enables the image to retain more details and subtleties in color and luminance.
On the other hand, a 16-bit float HDR image utilizes 16 bits per color channel, resulting in a reduced range of values that can be represented. This lower precision leads to a loss of fine details and color nuances, especially in highly contrasted areas of the image where there are significant differences in luminance.
The drop in accuracy between 32-bit and 16-bit float HDR images becomes more noticeable as the exposure range of the scene increases. Exposure range refers to the span between the darkest and brightest areas of an image. In scenes with a limited exposure range, where the luminance differences are relatively small, the loss of accuracy may not be as prominent or perceptible. These images usually are around 8-10 exposure levels.
However, in scenes with a wide exposure range, such as a landscape with deep shadows and bright highlights, the reduced precision of a 16-bit float HDR image can result in visible artifacts like color banding, posterization, and loss of detail in both shadows and highlights. The image may exhibit abrupt transitions between tones or colors, which can appear unnatural and less realistic.
To provide a rough estimate, it is often observed that exposure values beyond approximately ±6 to ±8 stops from the middle gray (18% reflectance) may be more prone to accuracy issues in a 16-bit float format. This range may vary depending on the specific implementation and encoding scheme used.
To summarize, the drop in accuracy between 32-bit and 16-bit float HDR images is mainly related to the reduced precision of color information. This decrease in precision becomes more apparent in scenes with a wide exposure range, affecting the representation of fine details and leading to visible artifacts in the image.
In practice, this means that exposure values beyond a certain range will experience a loss of accuracy and detail when stored in a 16-bit float format. The exact range at which this loss occurs depends on the encoding scheme and the specific implementation. However, in general, extremely bright or extremely dark values that fall outside the representable range may be subject to quantization errors, resulting in loss of detail, banding, or other artifacts.
HDRs used for lighting purposes are usually slightly convolved to improve on sampling speed and removing specular artefacts. To that extent, 16 bit float HDRIs tend to me most used in CG cycles.


LIGHTING
-
GretagMacbeth Color Checker Numeric Values and Middle Gray
Read more: GretagMacbeth Color Checker Numeric Values and Middle GrayThe human eye perceives half scene brightness not as the linear 50% of the present energy (linear nature values) but as 18% of the overall brightness. We are biased to perceive more information in the dark and contrast areas. A Macbeth chart helps with calibrating back into a photographic capture into this “human perspective” of the world.
https://en.wikipedia.org/wiki/Middle_gray
In photography, painting, and other visual arts, middle gray or middle grey is a tone that is perceptually about halfway between black and white on a lightness scale in photography and printing, it is typically defined as 18% reflectance in visible light
Light meters, cameras, and pictures are often calibrated using an 18% gray card[4][5][6] or a color reference card such as a ColorChecker. On the assumption that 18% is similar to the average reflectance of a scene, a grey card can be used to estimate the required exposure of the film.
https://en.wikipedia.org/wiki/ColorChecker

The exposure meter in the camera does not know whether the subject itself is bright or not. It simply measures the amount of light that comes in, and makes a guess based on that. The camera will aim for 18% gray independently, meaning if you take a photo of an entirely white surface, and an entirely black surface you should get two identical images which both are gray (at least in theory). Thus enters the Macbeth chart.

<!–more–>
Note that Chroma Key Green is reasonably close to an 18% gray reflectance.
http://www.rags-int-inc.com/PhotoTechStuff/MacbethTarget/

No Camera Data 
https://upload.wikimedia.org/wikipedia/commons/b/b4/CIE1931xy_ColorChecker_SMIL.svg

RGB coordinates of the Macbeth ColorChecker
https://pdfs.semanticscholar.org/0e03/251ad1e6d3c3fb9cb0b1f9754351a959e065.pdf


-
Christopher Butler – Understanding the Eye-Mind Connection – Vision is a mental process
Read more: Christopher Butler – Understanding the Eye-Mind Connection – Vision is a mental processhttps://www.chrbutler.com/understanding-the-eye-mind-connection
The intricate relationship between the eyes and the brain, often termed the eye-mind connection, reveals that vision is predominantly a cognitive process. This understanding has profound implications for fields such as design, where capturing and maintaining attention is paramount. This essay delves into the nuances of visual perception, the brain’s role in interpreting visual data, and how this knowledge can be applied to effective design strategies.
This cognitive aspect of vision is evident in phenomena such as optical illusions, where the brain interprets visual information in a way that contradicts physical reality. These illusions underscore that what we “see” is not merely a direct recording of the external world but a constructed experience shaped by cognitive processes.
Understanding the cognitive nature of vision is crucial for effective design. Designers must consider how the brain processes visual information to create compelling and engaging visuals. This involves several key principles:
- Attention and Engagement
- Visual Hierarchy
- Cognitive Load Management
- Context and Meaning
-
Photography basics: Why Use a (MacBeth) Color Chart?
Read more: Photography basics: Why Use a (MacBeth) Color Chart?Start here: https://www.pixelsham.com/2013/05/09/gretagmacbeth-color-checker-numeric-values/
https://www.studiobinder.com/blog/what-is-a-color-checker-tool/


In LightRoom

in Final Cut

in Nuke
Note: In Foundry’s Nuke, the software will map 18% gray to whatever your center f/stop is set to in the viewer settings (f/8 by default… change that to EV by following the instructions below).
You can experiment with this by attaching an Exposure node to a Constant set to 0.18, setting your viewer read-out to Spotmeter, and adjusting the stops in the node up and down. You will see that a full stop up or down will give you the respective next value on the aperture scale (f8, f11, f16 etc.).One stop doubles or halves the amount or light that hits the filmback/ccd, so everything works in powers of 2.
So starting with 0.18 in your constant, you will see that raising it by a stop will give you .36 as a floating point number (in linear space), while your f/stop will be f/11 and so on.If you set your center stop to 0 (see below) you will get a relative readout in EVs, where EV 0 again equals 18% constant gray.

In other words. Setting the center f-stop to 0 means that in a neutral plate, the middle gray in the macbeth chart will equal to exposure value 0. EV 0 corresponds to an exposure time of 1 sec and an aperture of f/1.0.
This will set the sun usually around EV12-17 and the sky EV1-4 , depending on cloud coverage.
To switch Foundry’s Nuke’s SpotMeter to return the EV of an image, click on the main viewport, and then press s, this opens the viewer’s properties. Now set the center f-stop to 0 in there. And the SpotMeter in the viewport will change from aperture and fstops to EV.
-
IES Light Profiles and editing software
Read more: IES Light Profiles and editing softwarehttp://www.derekjenson.com/3d-blog/ies-light-profiles
https://ieslibrary.com/en/browse#ies
https://leomoon.com/store/shaders/ies-lights-pack
https://docs.arnoldrenderer.com/display/a5afmug/ai+photometric+light
IES profiles are useful for creating life-like lighting, as they can represent the physical distribution of light from any light source.
The IES format was created by the Illumination Engineering Society, and most lighting manufacturers provide IES profile for the lights they manufacture.


COLLECTIONS
| Featured AI
| Design And Composition
| Explore posts
POPULAR SEARCHES
unreal | pipeline | virtual production | free | learn | photoshop | 360 | macro | google | nvidia | resolution | open source | hdri | real-time | photography basics | nuke
FEATURED POSTS
-
Rec-2020 – TVs new color gamut standard used by Dolby Vision?
-
Top 3D Printing Website Resources
-
What’s the Difference Between Ray Casting, Ray Tracing, Path Tracing and Rasterization? Physical light tracing…
-
Image rendering bit depth
-
Game Development tips
-
59 AI Filmmaking Tools For Your Workflow
-
Photography basics: Production Rendering Resolution Charts
-
Photography basics: Exposure Value vs Photographic Exposure vs Il/Luminance vs Pixel luminance measurements
Social Links
DISCLAIMER – Links and images on this website may be protected by the respective owners’ copyright. All data submitted by users through this site shall be treated as freely available to share.
