


COMPOSITION
DESIGN
COLOR
-
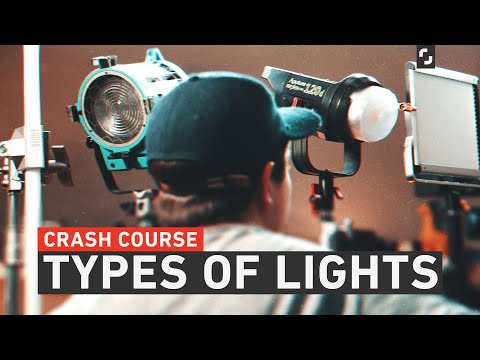
Types of Film Lights and their efficiency – CRI, Color Temperature and Luminous Efficacy
Read more: Types of Film Lights and their efficiency – CRI, Color Temperature and Luminous Efficacynofilmschool.com/types-of-film-lights
“Not every light performs the same way. Lights and lighting are tricky to handle. You have to plan for every circumstance. But the good news is, lighting can be adjusted. Let’s look at different factors that affect lighting in every scene you shoot. ”
Use CRI, Luminous Efficacy and color temperature controls to match your needs.

Color Temperature
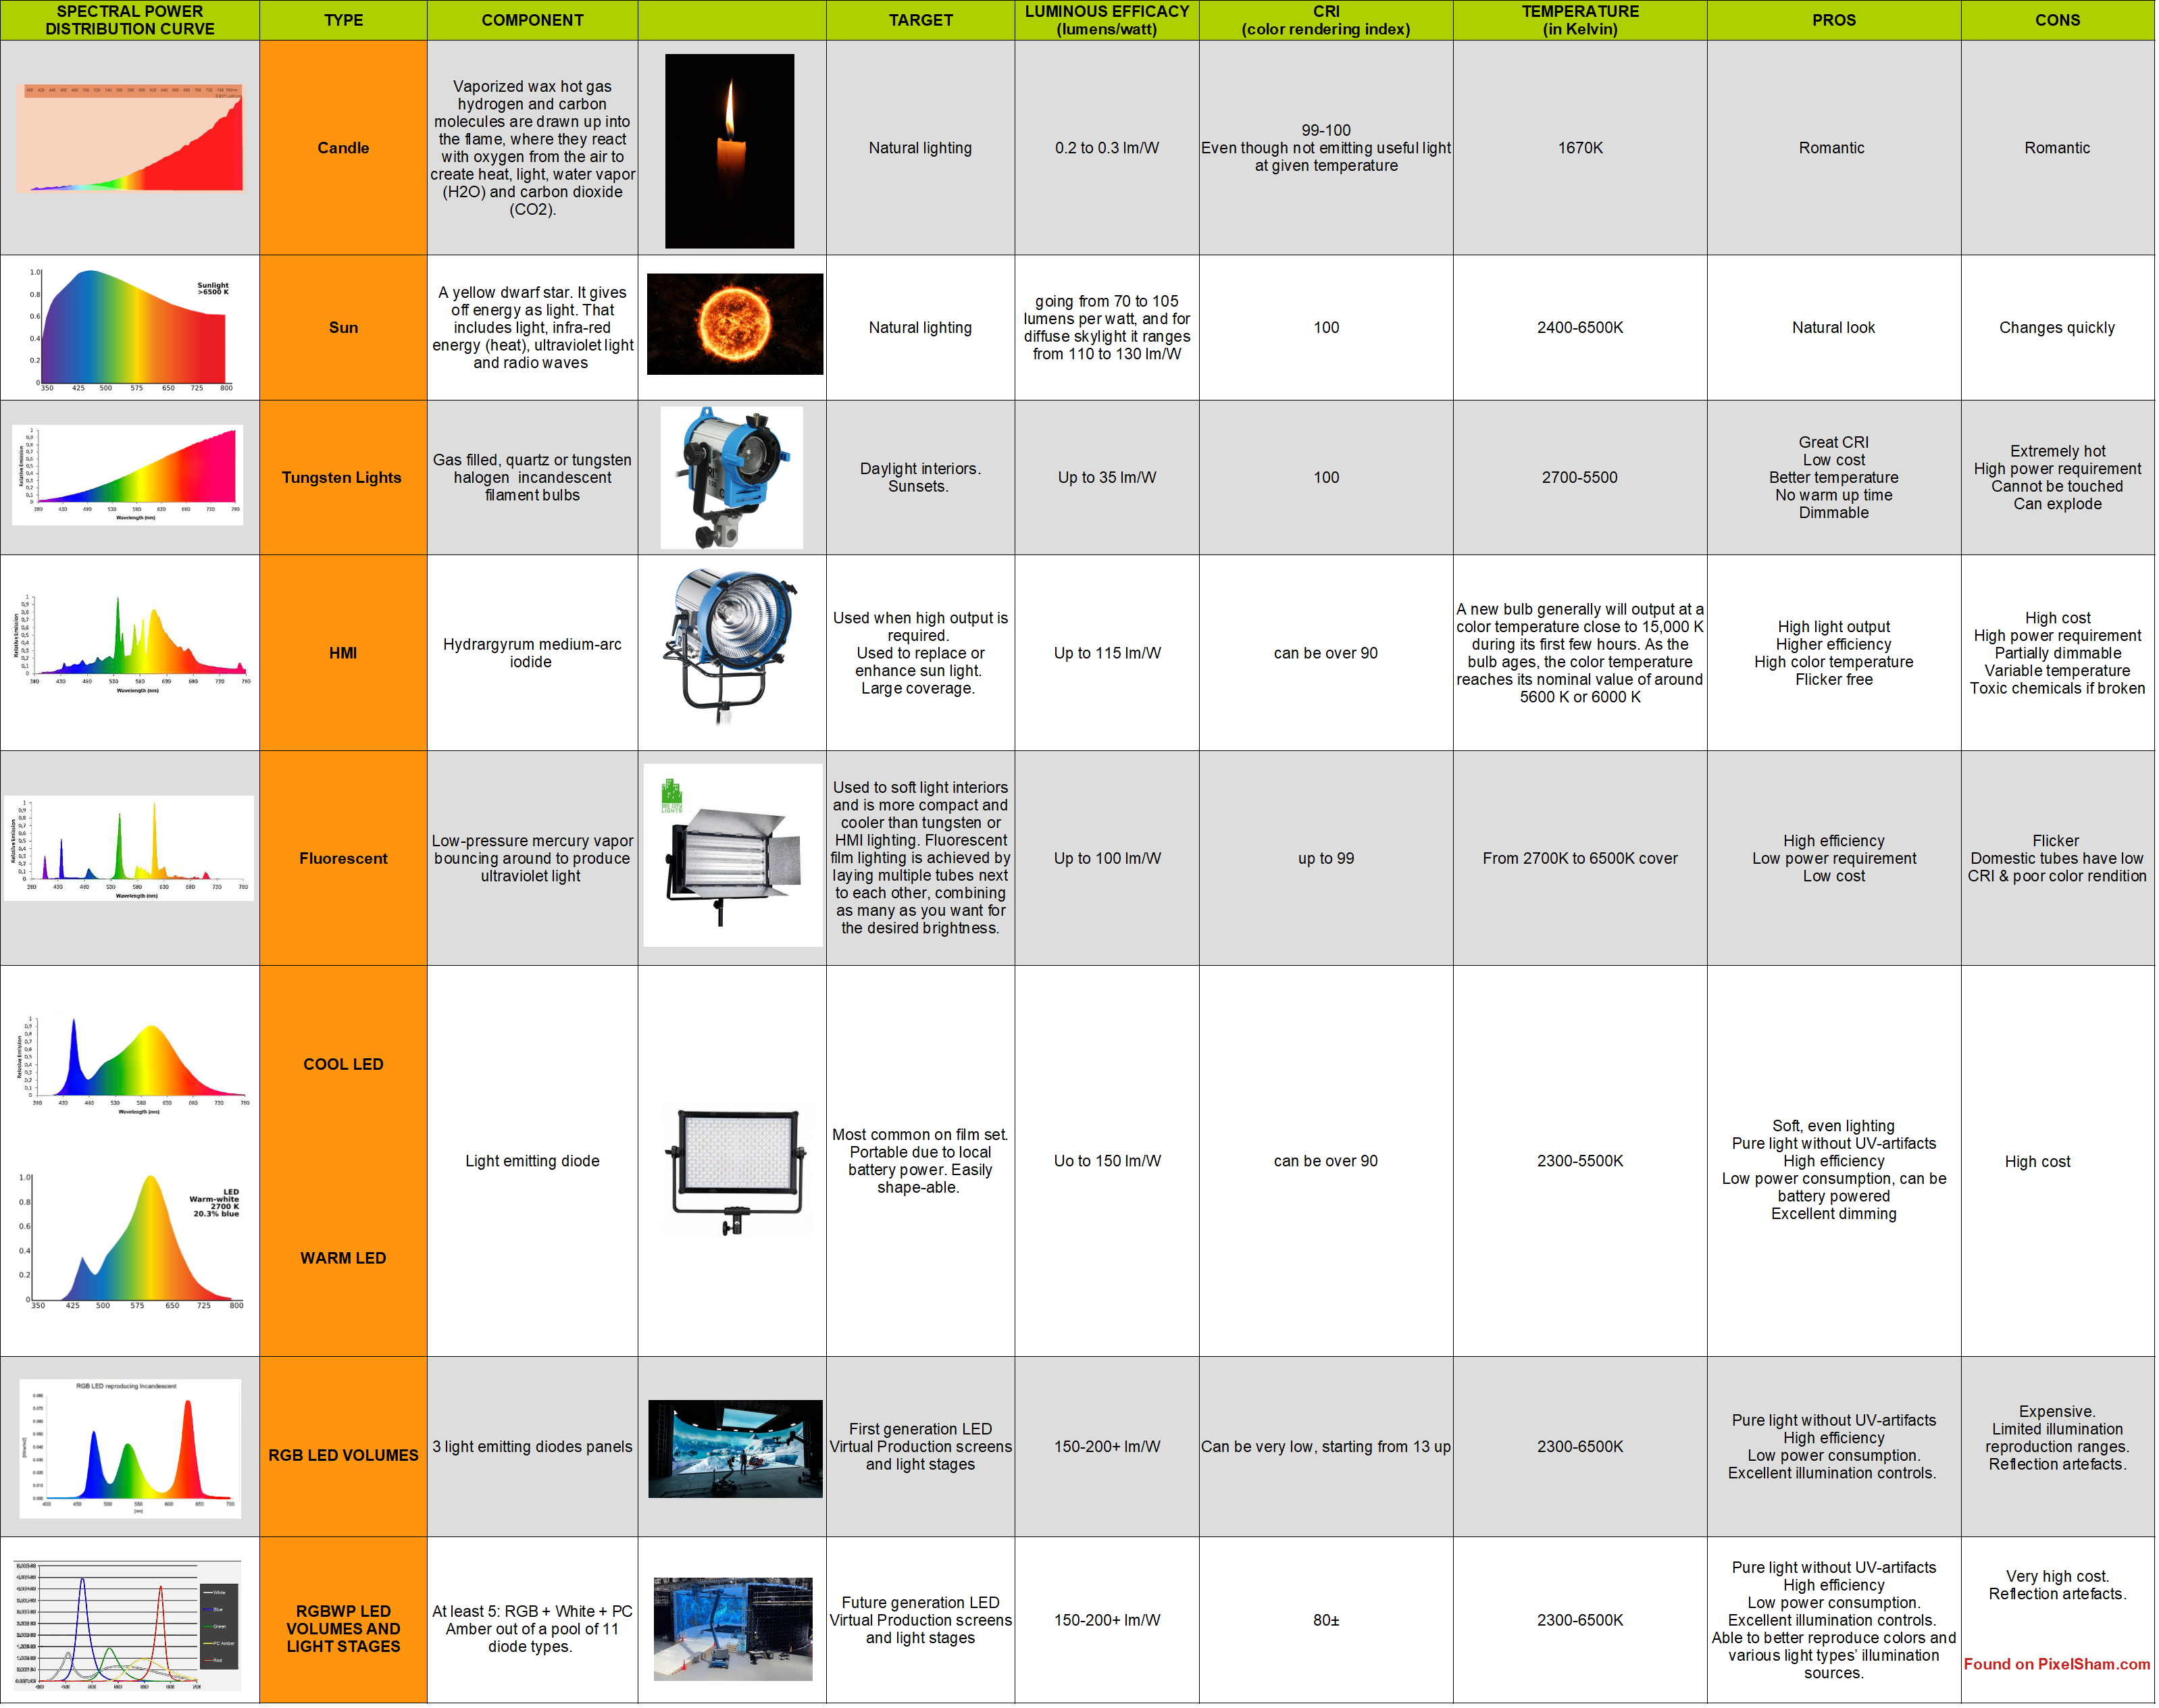
Color temperature describes the “color” of white light by a light source radiated by a perfect black body at a given temperature measured in degrees Kelvinhttps://www.pixelsham.com/2019/10/18/color-temperature/
CRI
“The Color Rendering Index is a measurement of how faithfully a light source reveals the colors of whatever it illuminates, it describes the ability of a light source to reveal the color of an object, as compared to the color a natural light source would provide. The highest possible CRI is 100. A CRI of 100 generally refers to a perfect black body, like a tungsten light source or the sun. ”https://www.studiobinder.com/blog/what-is-color-rendering-index/


https://en.wikipedia.org/wiki/Color_rendering_index
Light source CCT (K) CRI Low-pressure sodium (LPS/SOX) 1800 −44 Clear mercury-vapor 6410 17 High-pressure sodium (HPS/SON) 2100 24 Coated mercury-vapor 3600 49 Halophosphate warm-white fluorescent 2940 51 Halophosphate cool-white fluorescent 4230 64 Tri-phosphor warm-white fluorescent 2940 73 Halophosphate cool-daylight fluorescent 6430 76 “White” SON 2700 82 Standard LED Lamp 2700–5000 83 Quartz metal halide 4200 85 Tri-phosphor cool-white fluorescent 4080 89 High-CRI LED lamp (blue LED) 2700–5000 95 Ceramic discharge metal-halide lamp 5400 96 Ultra-high-CRI LED lamp (violet LED) 2700–5000 99 Incandescent/halogen bulb 3200 100 Luminous Efficacy
Luminous efficacy is a measure of how well a light source produces visible light, watts out versus watts in, measured in lumens per watt. In other words it is a measurement that indicates the ability of a light source to emit visible light using a given amount of power. It is a ratio of the visible energy to the power that goes into the bulb.FILM LIGHT TYPES
Consumer light types
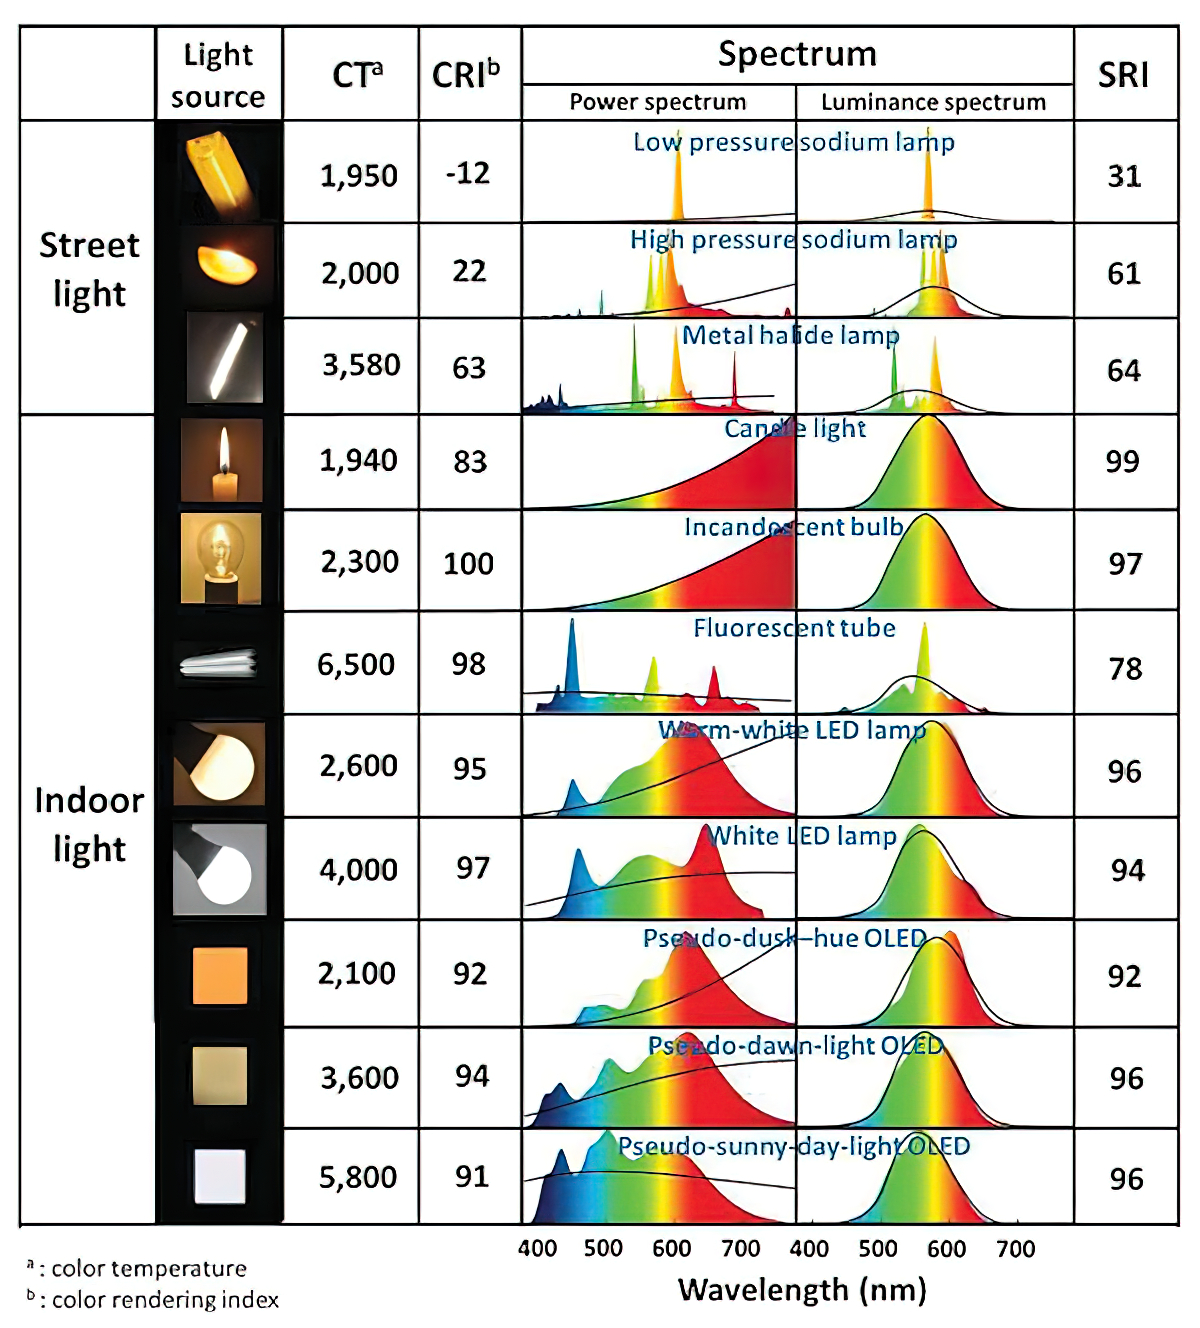
Tungsten Lights
Light interiors and match domestic places or office locations. Daylight.Advantages of Tungsten Lights
Almost perfect color rendition
Low cost
Does not use mercury like CFLs (fluorescent) or mercury vapor lights
Better color temperature than standard tungsten
Longer life than a conventional incandescent
Instant on to full brightness, no warm-up time, and it is dimmableDisadvantages of Tungsten Lights
Extremely hot
High power requirement
The lamp is sensitive to oils and cannot be touched
The bulb is capable of blowing and sending hot glass shards outward. A screen or layer of glass on the outside of the lamp can protect users.Hydrargyrum medium-arc iodide lights
HMI’s are used when high output is required. They are also used to recreate sun shining through windows or to fake additional sun while shooting exteriors. HMIs can light huge areas at once.Advantages of HMI lights
High light output
Higher efficiency
High color temperatureDisadvantages of HMI lights:
High cost
High power requirement
Dims only to about 50%
the color temperature increases with dimming
HMI bulbs will explode is dropped and release toxic chemicalsFluorescent
Fluorescent film lighting is achieved by laying multiple tubes next to each other, combining as many as you want for the desired brightness. The good news is you can choose your bulbs to either be warm or cool depending on the scenario you’re shooting. You want to get these bulbs close to the subject because they’re not great at opening up spaces. Fluorescent lighting is used to light interiors and is more compact and cooler than tungsten or HMI lighting.Advantages of Fluorescent lights
High efficiency
Low power requirement
Low cost
Long lamp life
Cool
Capable of soft even lighting over a large area
LightweightDisadvantages of Fluorescent lights
Flicker
High CRI
Domestic tubes have low CRI & poor color rendition.LED
LED’s are more and more common on film sets. You can use batteries to power them. That makes them portable and sleek – no messy cabled needed. You can rig your own panels of LED lights to fit any space necessary as well. LED’s can also power Fresnel style lamp heads such as the Arri L-series.Advantages of LED light
Soft, even lighting
Pure light without UV-artifacts
High efficiency
Low power consumption, can be battery powered
Excellent dimming by means of pulse width modulation control
Long lifespan
Environmentally friendly
Insensitive to shock
No risk of explosionDisadvantages of LED light
High cost.
LED’s are currently still expensive for their total light output


LIGHTING
-
Rendering – BRDF – Bidirectional reflectance distribution function
Read more: Rendering – BRDF – Bidirectional reflectance distribution functionhttp://en.wikipedia.org/wiki/Bidirectional_reflectance_distribution_function
The bidirectional reflectance distribution function is a four-dimensional function that defines how light is reflected at an opaque surface
http://www.cs.ucla.edu/~zhu/tutorial/An_Introduction_to_BRDF-Based_Lighting.pdf
In general, when light interacts with matter, a complicated light-matter dynamic occurs. This interaction depends on the physical characteristics of the light as well as the physical composition and characteristics of the matter.
That is, some of the incident light is reflected, some of the light is transmitted, and another portion of the light is absorbed by the medium itself.
A BRDF describes how much light is reflected when light makes contact with a certain material. Similarly, a BTDF (Bi-directional Transmission Distribution Function) describes how much light is transmitted when light makes contact with a certain material
http://www.cs.princeton.edu/~smr/cs348c-97/surveypaper.html
It is difficult to establish exactly how far one should go in elaborating the surface model. A truly complete representation of the reflective behavior of a surface might take into account such phenomena as polarization, scattering, fluorescence, and phosphorescence, all of which might vary with position on the surface. Therefore, the variables in this complete function would be:
incoming and outgoing angle incoming and outgoing wavelength incoming and outgoing polarization (both linear and circular) incoming and outgoing position (which might differ due to subsurface scattering) time delay between the incoming and outgoing light ray
-
7 Easy Portrait Lighting Setups
Read more: 7 Easy Portrait Lighting Setups
Butterfly
Loop
Rembrandt
Split
Rim
Broad
Short
-
What is the Light Field?
Read more: What is the Light Field?http://lightfield-forum.com/what-is-the-lightfield/
The light field consists of the total of all light rays in 3D space, flowing through every point and in every direction.
How to Record a Light Field
- a single, robotically controlled camera
- a rotating arc of cameras
- an array of cameras or camera modules
- a single camera or camera lens fitted with a microlens array


-
Composition – cinematography Cheat Sheet
Read more: Composition – cinematography Cheat Sheet
Where is our eye attracted first? Why?
Size. Focus. Lighting. Color.
Size. Mr. White (Harvey Keitel) on the right.
Focus. He’s one of the two objects in focus.
Lighting. Mr. White is large and in focus and Mr. Pink (Steve Buscemi) is highlighted by
a shaft of light.
Color. Both are black and white but the read on Mr. White’s shirt now really stands out.
What type of lighting?-> High key lighting.
Features bright, even illumination and few conspicuous shadows. This lighting key is often used in musicals and comedies.Low key lighting
Features diffused shadows and atmospheric pools of light. This lighting key is often used in mysteries and thrillers.High contrast lighting
Features harsh shafts of lights and dramatic streaks of blackness. This type of lighting is often used in tragedies and melodramas.What type of shot?
Extreme long shot
Taken from a great distance, showing much of the locale. Ifpeople are included in these shots, they usually appear as mere specks-> Long shot
Corresponds to the space between the audience and the stage in a live theater. The long shots show the characters and some of the locale.Full shot
Range with just enough space to contain the human body in full. The full shot shows the character and a minimal amount of the locale.Medium shot
Shows the human figure from the knees or waist up.Close-Up
Concentrates on a relatively small object and show very little if any locale.Extreme close-up
Focuses on an unnaturally small portion of an object, giving that part great detail and symbolic significance.What angle?
Bird’s-eye view.
The shot is photographed directly from above. This type of shot can be disorienting, and the people photographed seem insignificant.High angle.
This angle reduces the size of the objects photographed. A person photographed from this angle seems harmless and insignificant, but to a lesser extent than with the bird’s-eye view.-> Eye-level shot.
The clearest view of an object, but seldom intrinsically dramatic, because it tends to be the norm.Low angle.
This angle increases high and a sense of verticality, heightening the importance of the object photographed. A person shot from this angle is given a sense of power and respect.Oblique angle.
For this angle, the camera is tilted laterally, giving the image a slanted appearance. Oblique angles suggest tension, transition, a impending movement. They are also called canted or dutch angles.What is the dominant color?
The use of color in this shot is symbolic. The scene is set in warehouse. Both the set and characters are blues, blacks and whites.
This was intentional allowing for the scenes and shots with blood to have a great level of contrast.
What is the Lens/Filter/Stock?
Telephoto lens.
A lens that draws objects closer but also diminishes the illusion of depth.Wide-angle lens.
A lens that takes in a broad area and increases the illusion of depth but sometimes distorts the edges of the image.Fast film stock.
Highly sensitive to light, it can register an image with little illumination. However, the final product tends to be grainy.Slow film stock.
Relatively insensitive to light, it requires a great deal of illumination. The final product tends to look polished.The lens is not wide-angle because there isn’t a great sense of depth, nor are several planes in focus. The lens is probably long but not necessarily a telephoto lens because the depth isn’t inordinately compressed.
The stock is fast because of the grainy quality of the image.
Subsidiary Contrast; where does the eye go next?
The two guns.
How much visual information is packed into the image? Is the texture stark, moderate, or highly detailed?
Minimalist clutter in the warehouse allows a focus on a character driven thriller.
What is the Composition?
Horizontal.
Compositions based on horizontal lines seem visually at rest and suggest placidity or peacefulness.Vertical.
Compositions based on vertical lines seem visually at rest and suggest strength.-> Diagonal.
Compositions based on diagonal, or oblique, lines seem dynamic and suggest tension or anxiety.-> Binary. Binary structures emphasize parallelism.
Triangle.
Triadic compositions stress the dynamic interplay among three mainCircle.
Circular compositions suggest security and enclosure.Is the form open or closed? Does the image suggest a window that arbitrarily isolates a fragment of the scene? Or a proscenium arch, in which the visual elements are carefully arranged and held in balance?
The most nebulous of all the categories of mise en scene, the type of form is determined by how consciously structured the mise en scene is. Open forms stress apparently simple techniques, because with these unself-conscious methods the filmmaker is able to emphasize the immediate, the familiar, the intimate aspects of reality. In open-form images, the frame tends to be deemphasized. In closed form images, all the necessary information is carefully structured within the confines of the frame. Space seems enclosed and self-contained rather than continuous.
Could argue this is a proscenium arch because this is such a classic shot with parallels and juxtapositions.
Is the framing tight or loose? Do the character have no room to move around, or can they move freely without impediments?
Shots where the characters are placed at the edges of the frame and have little room to move around within the frame are considered tight.
Longer shots, in which characters have room to move around within the frame, are considered loose and tend to suggest freedom.
Center-framed giving us the entire scene showing isolation, place and struggle.
Depth of Field. On how many planes is the image composed (how many are in focus)? Does the background or foreground comment in any way on the mid-ground?
Standard DOF, one background and clearly defined foreground.
Which way do the characters look vis-a-vis the camera?
An actor can be photographed in any of five basic positions, each conveying different psychological overtones.
Full-front (facing the camera):
the position with the most intimacy. The character is looking in our direction, inviting our complicity.Quarter Turn:
the favored position of most filmmakers. This position offers a high degree of intimacy but with less emotional involvement than the full-front.-> Profile (looking of the frame left or right):
More remote than the quarter turn, the character in profile seems unaware of being observed, lost in his or her own thoughts.Three-quarter Turn:
More anonymous than the profile, this position is useful for conveying a character’s unfriendly or antisocial feelings, for in effect, the character is partially turning his or her back on us, rejecting our interest.Back to Camera:
The most anonymous of all positions, this position is often used to suggest a character’s alienation from the world. When a character has his or her back to the camera, we can only guess what’s taking place internally, conveying a sense of concealment, or mystery.How much space is there between the characters?
Extremely close, for a gunfight.
The way people use space can be divided into four proxemic patterns.
Intimate distances.
The intimate distance ranges from skin contact to about eighteen inches away. This is the distance of physical involvement–of love, comfort, and tenderness between individuals.-> Personal distances.
The personal distance ranges roughly from eighteen inches away to about four feet away. These distances tend to be reserved for friends and acquaintances. Personal distances preserve the privacy between individuals, yet these rages don’t necessarily suggest exclusion, as intimate distances often do.Social distances.
The social distance rages from four feet to about twelve feet. These distances are usually reserved for impersonal business and casual social gatherings. It’s a friendly range in most cases, yet somewhat more formal than the personal distance.Public distances.
The public distance extends from twelve feet to twenty-five feet or more. This range tends to be formal and rather detached.


COLLECTIONS
| Featured AI
| Design And Composition
| Explore posts
POPULAR SEARCHES
unreal | pipeline | virtual production | free | learn | photoshop | 360 | macro | google | nvidia | resolution | open source | hdri | real-time | photography basics | nuke
FEATURED POSTS
Social Links
DISCLAIMER – Links and images on this website may be protected by the respective owners’ copyright. All data submitted by users through this site shall be treated as freely available to share.
