


COMPOSITION
-
Cinematographers Blueprint 300dpi poster
Read more: Cinematographers Blueprint 300dpi posterThe 300dpi digital poster is now available to all PixelSham.com subscribers.

If you have already subscribed and wish a copy, please send me a note through the contact page.
-
Composition and The Expressive Nature Of Light
Read more: Composition and The Expressive Nature Of Lighthttp://www.huffingtonpost.com/bill-danskin/post_12457_b_10777222.html
George Sand once said “ The artist vocation is to send light into the human heart.”

-
Composition – These are the basic lighting techniques you need to know for photography and film
Read more: Composition – These are the basic lighting techniques you need to know for photography and film
http://www.diyphotography.net/basic-lighting-techniques-need-know-photography-film/
Amongst the basic techniques, there’s…
1- Side lighting – Literally how it sounds, lighting a subject from the side when they’re faced toward you
2- Rembrandt lighting – Here the light is at around 45 degrees over from the front of the subject, raised and pointing down at 45 degrees
3- Back lighting – Again, how it sounds, lighting a subject from behind. This can help to add drama with silouettes
4- Rim lighting – This produces a light glowing outline around your subject
5- Key light – The main light source, and it’s not necessarily always the brightest light source
6- Fill light – This is used to fill in the shadows and provide detail that would otherwise be blackness
7- Cross lighting – Using two lights placed opposite from each other to light two subjects
-
Christopher Butler – Understanding the Eye-Mind Connection – Vision is a mental process
Read more: Christopher Butler – Understanding the Eye-Mind Connection – Vision is a mental processhttps://www.chrbutler.com/understanding-the-eye-mind-connection
The intricate relationship between the eyes and the brain, often termed the eye-mind connection, reveals that vision is predominantly a cognitive process. This understanding has profound implications for fields such as design, where capturing and maintaining attention is paramount. This essay delves into the nuances of visual perception, the brain’s role in interpreting visual data, and how this knowledge can be applied to effective design strategies.
This cognitive aspect of vision is evident in phenomena such as optical illusions, where the brain interprets visual information in a way that contradicts physical reality. These illusions underscore that what we “see” is not merely a direct recording of the external world but a constructed experience shaped by cognitive processes.
Understanding the cognitive nature of vision is crucial for effective design. Designers must consider how the brain processes visual information to create compelling and engaging visuals. This involves several key principles:
- Attention and Engagement
- Visual Hierarchy
- Cognitive Load Management
- Context and Meaning


DESIGN
COLOR
-
Polarised vs unpolarized filtering
Read more: Polarised vs unpolarized filteringA light wave that is vibrating in more than one plane is referred to as unpolarized light. …
Polarized light waves are light waves in which the vibrations occur in a single plane. The process of transforming unpolarized light into polarized light is known as polarization.

en.wikipedia.org/wiki/Polarizing_filter_(photography)
The most common use of polarized technology is to reduce lighting complexity on the subject.
Details such as glare and hard edges are not removed, but greatly reduced.This method is usually used in VFX to capture raw images with the least amount of specular diffusion or pollution, thus allowing artists to infer detail back through typical shading and rendering techniques and on demand.
Light reflected from a non-metallic surface becomes polarized; this effect is maximum at Brewster’s angle, about 56° from the vertical for common glass.
A polarizer rotated to pass only light polarized in the direction perpendicular to the reflected light will absorb much of it. This absorption allows glare reflected from, for example, a body of water or a road to be reduced. Reflections from shiny surfaces (e.g. vegetation, sweaty skin, water surfaces, glass) are also reduced. This allows the natural color and detail of what is beneath to come through. Reflections from a window into a dark interior can be much reduced, allowing it to be seen through. (The same effects are available for vision by using polarizing sunglasses.)

www.physicsclassroom.com/class/light/u12l1e.cfm
Some of the light coming from the sky is polarized (bees use this phenomenon for navigation). The electrons in the air molecules cause a scattering of sunlight in all directions. This explains why the sky is not dark during the day. But when looked at from the sides, the light emitted from a specific electron is totally polarized.[3] Hence, a picture taken in a direction at 90 degrees from the sun can take advantage of this polarization.

Use of a polarizing filter, in the correct direction, will filter out the polarized component of skylight, darkening the sky; the landscape below it, and clouds, will be less affected, giving a photograph with a darker and more dramatic sky, and emphasizing the clouds.

There are two types of polarizing filters readily available, linear and “circular”, which have exactly the same effect photographically. But the metering and auto-focus sensors in certain cameras, including virtually all auto-focus SLRs, will not work properly with linear polarizers because the beam splitters used to split off the light for focusing and metering are polarization-dependent.
Polarizing filters reduce the light passed through to the film or sensor by about one to three stops (2–8×) depending on how much of the light is polarized at the filter angle selected. Auto-exposure cameras will adjust for this by widening the aperture, lengthening the time the shutter is open, and/or increasing the ASA/ISO speed of the camera.
www.adorama.com/alc/nd-filter-vs-polarizer-what%25e2%2580%2599s-the-difference
Neutral Density (ND) filters help control image exposure by reducing the light that enters the camera so that you can have more control of your depth of field and shutter speed. Polarizers or polarizing filters work in a similar way, but the difference is that they selectively let light waves of a certain polarization pass through. This effect helps create more vivid colors in an image, as well as manage glare and reflections from water surfaces. Both are regarded as some of the best filters for landscape and travel photography as they reduce the dynamic range in high-contrast images, thus enabling photographers to capture more realistic and dramatic sceneries.
shopfelixgray.com/blog/polarized-vs-non-polarized-sunglasses/
www.eyebuydirect.com/blog/difference-polarized-nonpolarized-sunglasses/

-
Yasuharu YOSHIZAWA – Comparison of sRGB vs ACREScg in Nuke
Read more: Yasuharu YOSHIZAWA – Comparison of sRGB vs ACREScg in NukeAnswering the question that is often asked, “Do I need to use ACEScg to display an sRGB monitor in the end?” (Demonstration shown at an in-house seminar)
Comparison of scanlineRender output with extreme color lights on color charts with sRGB/ACREScg in color – OCIO -working space in NukeDownload the Nuke script:
-
About green screens
Read more: About green screenshackaday.com/2015/02/07/how-green-screen-worked-before-computers/
www.newtek.com/blog/tips/best-green-screen-materials/
www.chromawall.com/blog//chroma-key-green

Chroma Key Green, the color of green screens is also known as Chroma Green and is valued at approximately 354C in the Pantone color matching system (PMS).
Chroma Green can be broken down in many different ways. Here is green screen green as other values useful for both physical and digital production:
Green Screen as RGB Color Value: 0, 177, 64
Green Screen as CMYK Color Value: 81, 0, 92, 0
Green Screen as Hex Color Value: #00b140
Green Screen as Websafe Color Value: #009933Chroma Key Green is reasonably close to an 18% gray reflectance.
Illuminate your green screen with an uniform source with less than 2/3 EV variation.
The level of brightness at any given f-stop should be equivalent to a 90% white card under the same lighting. -
Rec-2020 – TVs new color gamut standard used by Dolby Vision?
Read more: Rec-2020 – TVs new color gamut standard used by Dolby Vision?https://www.hdrsoft.com/resources/dri.html#bit-depth
The dynamic range is a ratio between the maximum and minimum values of a physical measurement. Its definition depends on what the dynamic range refers to.
For a scene: Dynamic range is the ratio between the brightest and darkest parts of the scene.
For a camera: Dynamic range is the ratio of saturation to noise. More specifically, the ratio of the intensity that just saturates the camera to the intensity that just lifts the camera response one standard deviation above camera noise.
For a display: Dynamic range is the ratio between the maximum and minimum intensities emitted from the screen.
The Dynamic Range of real-world scenes can be quite high — ratios of 100,000:1 are common in the natural world. An HDR (High Dynamic Range) image stores pixel values that span the whole tonal range of real-world scenes. Therefore, an HDR image is encoded in a format that allows the largest range of values, e.g. floating-point values stored with 32 bits per color channel. Another characteristics of an HDR image is that it stores linear values. This means that the value of a pixel from an HDR image is proportional to the amount of light measured by the camera.
For TVs HDR is great, but it’s not the only new TV feature worth discussing.
Wide color gamut, or WCG, is often lumped in with HDR. While they’re often found together, they’re not intrinsically linked. Where HDR is an increase in the dynamic range of the picture (with contrast and brighter highlights in particular), a TV’s wide color gamut coverage refers to how much of the new, larger color gamuts a TV can display.
Wide color gamuts only really matter for HDR video sources like UHD Blu-rays and some streaming video, as only HDR sources are meant to take advantage of the ability to display more colors.
www.cnet.com/how-to/what-is-wide-color-gamut-wcg/
Color depth is only one aspect of color representation, expressing the precision with which the amount of each primary can be expressed through a pixel; the other aspect is how broad a range of colors can be expressed (the gamut)
Image rendering bit depth
Wide color gamuts include a greater number of colors than what most current TVs can display, so the greater a TV’s coverage of a wide color gamut, the more colors a TV will be able to reproduce.
When we talk about a color space or color gamut we refer to the range of color values stored in an image. The perception of these color also requires a display that has been tuned with to resolve these color profiles at best. This is often referred to as a ‘viewer lut’.
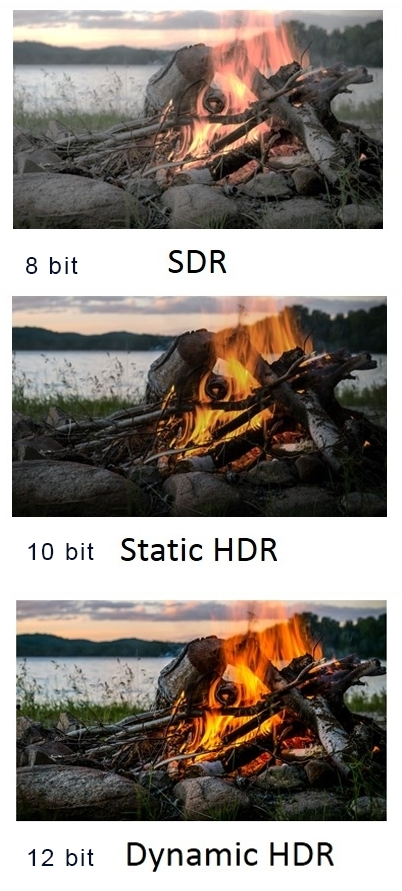
So this comes also usually paired with an increase in bit depth, going from the old 8 bit system (256 shades per color, with the potential of over 16.7 million colors: 256 green x 256 blue x 256 red) to 10 (1024+ shades per color, with access to over a billion colors) or higher bits, like 12 bit (4096 shades per RGB for 68 billion colors).
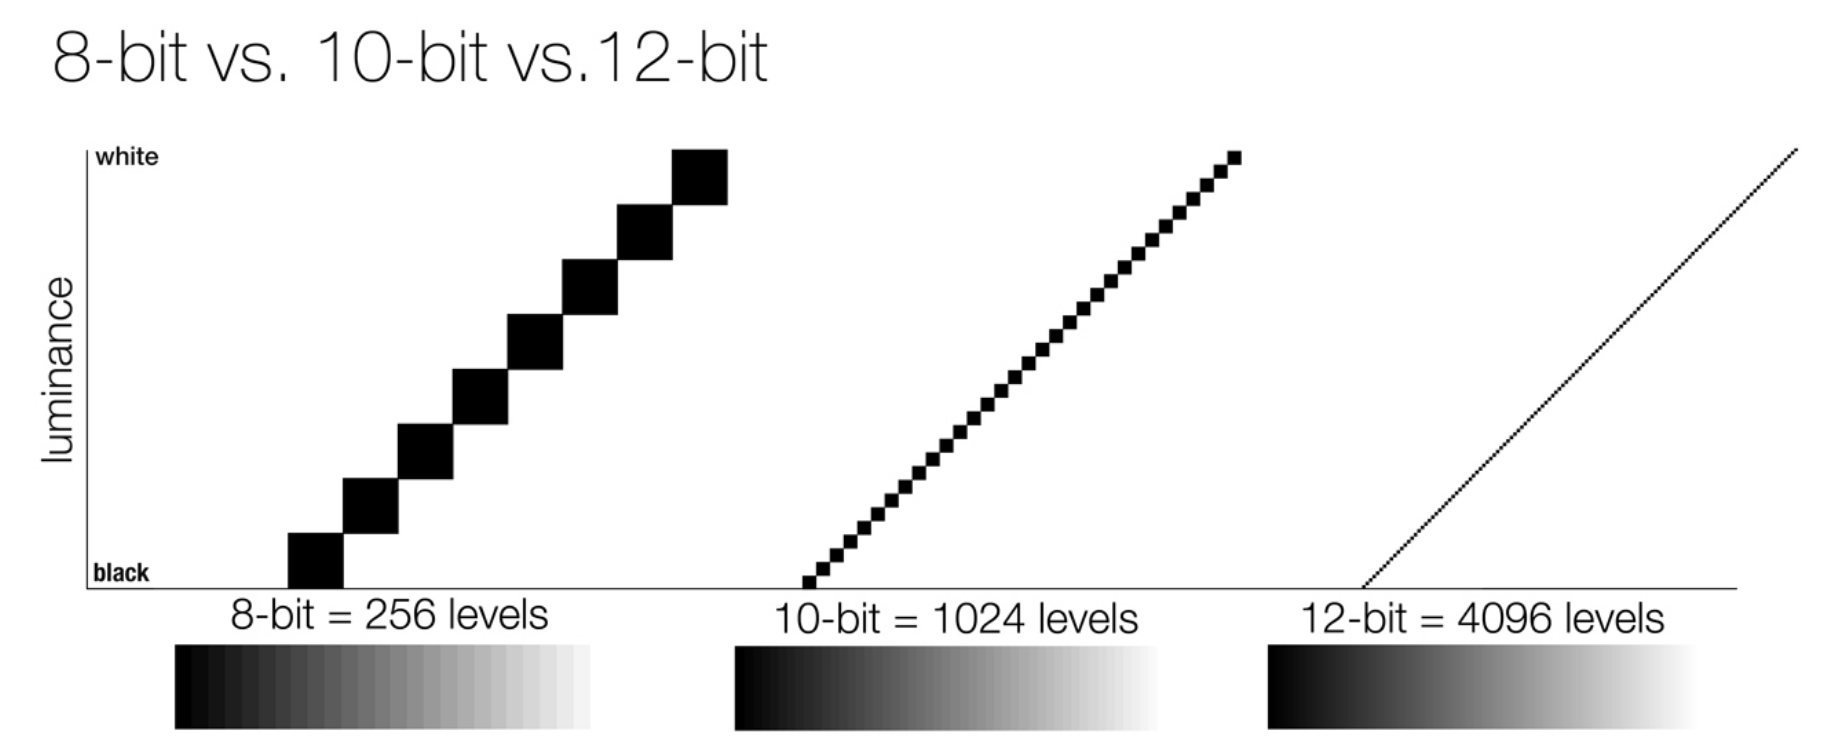
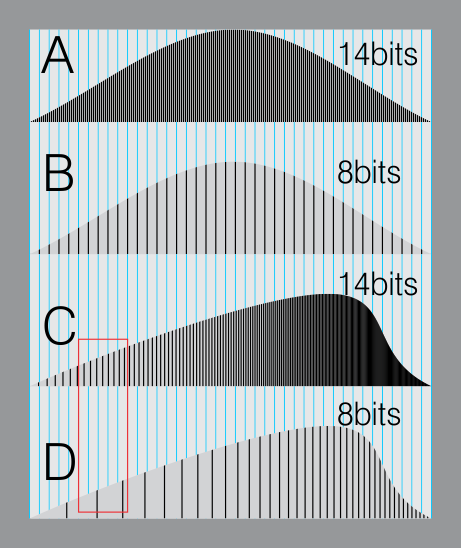
The advantage of higher bit depth is in the ability to bias color with the minimum loss.
For an extreme example, raising the brightness from a completely dark image allows for better reproduction, independently on the reproduction medium, due to the amount of data available at editing time:
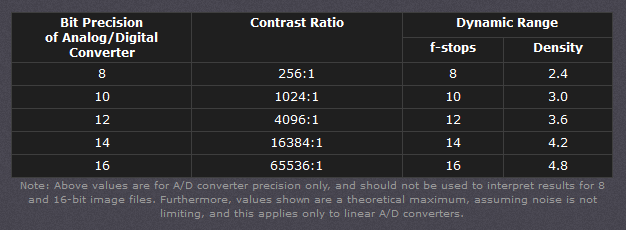
For reference, 8-bit images (i.e. 24 bits per pixel for a color image) are considered Low Dynamic Range.
They can store around 5 stops of light and each pixel carry a value from 0 (black) to 255 (white).
As a comparison, DSLR cameras can capture ~12-15 stops of light and they use RAW files to store the information.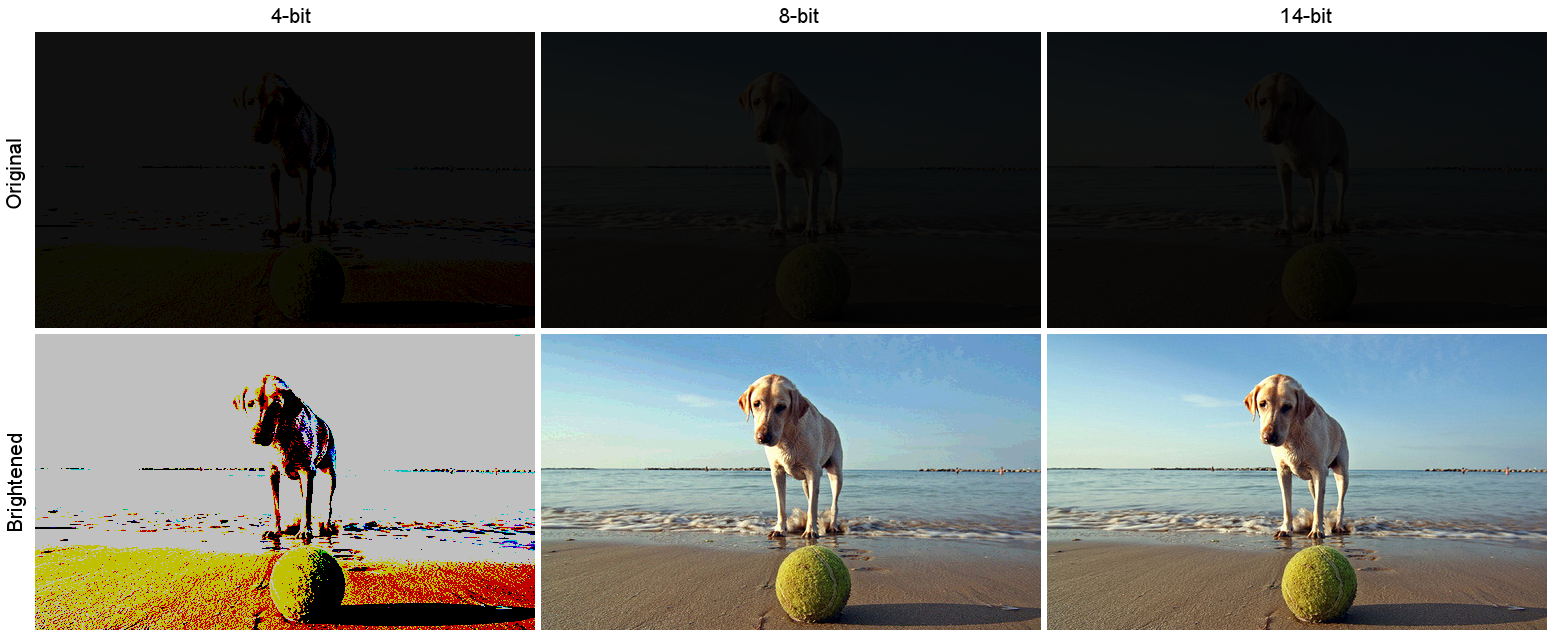
https://www.cambridgeincolour.com/tutorials/dynamic-range.htm
https://www.hdrsoft.com/resources/dri.html#bit-depth
Note that the number of bits itself may be a misleading indication of the real dynamic range that the image reproduces — converting a Low Dynamic Range image to a higher bit depth does not change its dynamic range, of course.
- 8-bit images (i.e. 24 bits per pixel for a color image) are considered Low Dynamic Range.
- 16-bit images (i.e. 48 bits per pixel for a color image) resulting from RAW conversion are still considered Low Dynamic Range, even though the range of values they can encode is significantly higher than for 8-bit images (65536 versus 256). Note that converting a RAW file involves applying a tonal curve that compresses the dynamic range of the RAW data so that the converted image shows correctly on low dynamic range monitors. The need to adapt the output image file to the dynamic range of the display is the factor that dictates how much the dynamic range is compressed, not the output bit-depth. By using 16 instead of 8 bits, you will gain precision but you will not gain dynamic range.
- 32-bit images (i.e. 96 bits per pixel for a color image) are considered High Dynamic Range.Unlike 8- and 16-bit images which can take a finite number of values, 32-bit images are coded using floating point numbers, which means the values they can take is unlimited.It is important to note, though, that storing an image in a 32-bit HDR format is a necessary condition for an HDR image but not a sufficient one. When an image comes from a single capture with a standard camera, it will remain a Low Dynamic Range image,
Also note that bit depth and dynamic range are often confused as one, but are indeed separate concepts and there is no direct one to one relationship between them. Bit depth is about capacity, dynamic range is about the actual ratio of data stored.
The bit depth of a capturing or displaying device gives you an indication of its dynamic range capacity. That is, the highest dynamic range that the device would be capable of reproducing if all other constraints are eliminated.https://rawpedia.rawtherapee.com/Bit_Depth
Finally, note that there are two ways to “count” bits for an image — either the number of bits per color channel (BPC) or the number of bits per pixel (BPP). A bit (0,1) is the smallest unit of data stored in a computer.
For a grayscale image, 8-bit means that each pixel can be one of 256 levels of gray (256 is 2 to the power 8).
For an RGB color image, 8-bit means that each one of the three color channels can be one of 256 levels of color.
Since each pixel is represented by 3 colors in this case, 8-bit per color channel actually means 24-bit per pixel.Similarly, 16-bit for an RGB image means 65,536 levels per color channel and 48-bit per pixel.
To complicate matters, when an image is classified as 16-bit, it just means that it can store a maximum 65,535 values. It does not necessarily mean that it actually spans that range. If the camera sensors can not capture more than 12 bits of tonal values, the actual bit depth of the image will be at best 12-bit and probably less because of noise.
The following table attempts to summarize the above for the case of an RGB color image.
Type of digital support Bit depth per color channel Bit depth per pixel FStops Theoretical maximum Dynamic Range Reality 8-bit 8 24 8 256:1 most consumer images 12-bit CCD 12 36 12 4,096:1 real maximum limited by noise 14-bit CCD 14 42 14 16,384:1 real maximum limited by noise 16-bit TIFF (integer) 16 48 16 65,536:1 bit-depth in this case is not directly related to the dynamic range captured 16-bit float EXR 16 48 30 65,536:1 values are distributed more closely in the (lower) darker tones than in the (higher) lighter ones, thus allowing for a more accurate description of the tones more significant to humans. The range of normalized 16-bit floats can represent thirty stops of information with 1024 steps per stop. We have eighteen and a half stops over middle gray, and eleven and a half below. The denormalized numbers provide an additional ten stops with decreasing precision per stop.
http://download.nvidia.com/developer/GPU_Gems/CD_Image/Image_Processing/OpenEXR/OpenEXR-1.0.6/doc/#recsHDR image (e.g. Radiance format) 32 96 “infinite” 4.3 billion:1 real maximum limited by the captured dynamic range 32-bit floats are often called “single-precision” floats, and 64-bit floats are often called “double-precision” floats. 16-bit floats therefore are called “half-precision” floats, or just “half floats”.
https://petapixel.com/2018/09/19/8-12-14-vs-16-bit-depth-what-do-you-really-need
On a separate note, even Photoshop does not handle 16bit per channel. Photoshop does actually use 16-bits per channel. However, it treats the 16th digit differently – it is simply added to the value created from the first 15-digits. This is sometimes called 15+1 bits. This means that instead of 216 possible values (which would be 65,536 possible values) there are only 215+1 possible values (which is 32,768 +1 = 32,769 possible values).
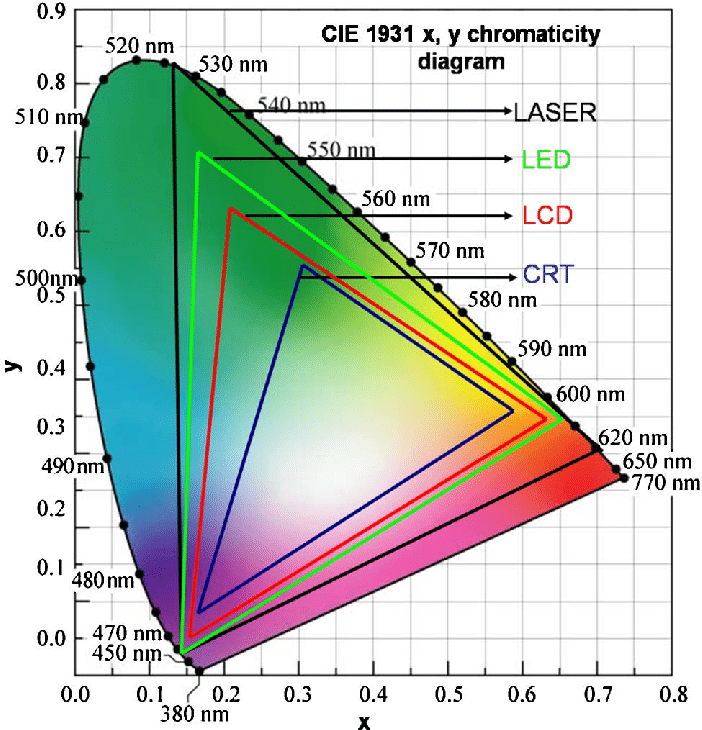
Rec-601 (for the older SDTV format, very similar to rec-709) and Rec-709 (the HDTV’s recommended set of color standards, at times also referred to sRGB, although not exactly the same) are currently the most spread color formats and hardware configurations in the world.
Following those you can find the larger P3 gamut, more commonly used in theaters and in digital production houses (with small variations and improvements to color coverage), as well as most of best 4K/WCG TVs.
And a new standard is now promoted against P3, referred to Rec-2020 and UHDTV.

It is still debatable if this is going to be adopted at consumer level beyond the P3, mainly due to lack of hardware supporting it. But initial tests do prove that it would be a future proof investment.
www.colour-science.org/anders-langlands/
Rec. 2020 is ultimately designed for television, and not cinema. Therefore, it is to be expected that its properties must behave according to current signal processing standards. In this respect, its foundation is based on current HD and SD video signal characteristics.
As far as color bit depth is concerned, it allows for a maximum of 12 bits, which is more than enough for humans.
Comparing standards, REC-709 covers 35.9% of the human visible spectrum. P3 45.5%. And REC-2020 75.8%.
https://www.avsforum.com/forum/166-lcd-flat-panel-displays/2812161-what-color-volume.htmlComparing coverage to hardware devices
To note that all the new standards generally score very high on the Pointer’s Gamut chart. But with REC-2020 scoring 99.9% vs P3 at 88.2%.
www.tftcentral.co.uk/articles/pointers_gamut.htmhttps://www.slideshare.net/hpduiker/acescg-a-common-color-encoding-for-visual-effects-applications
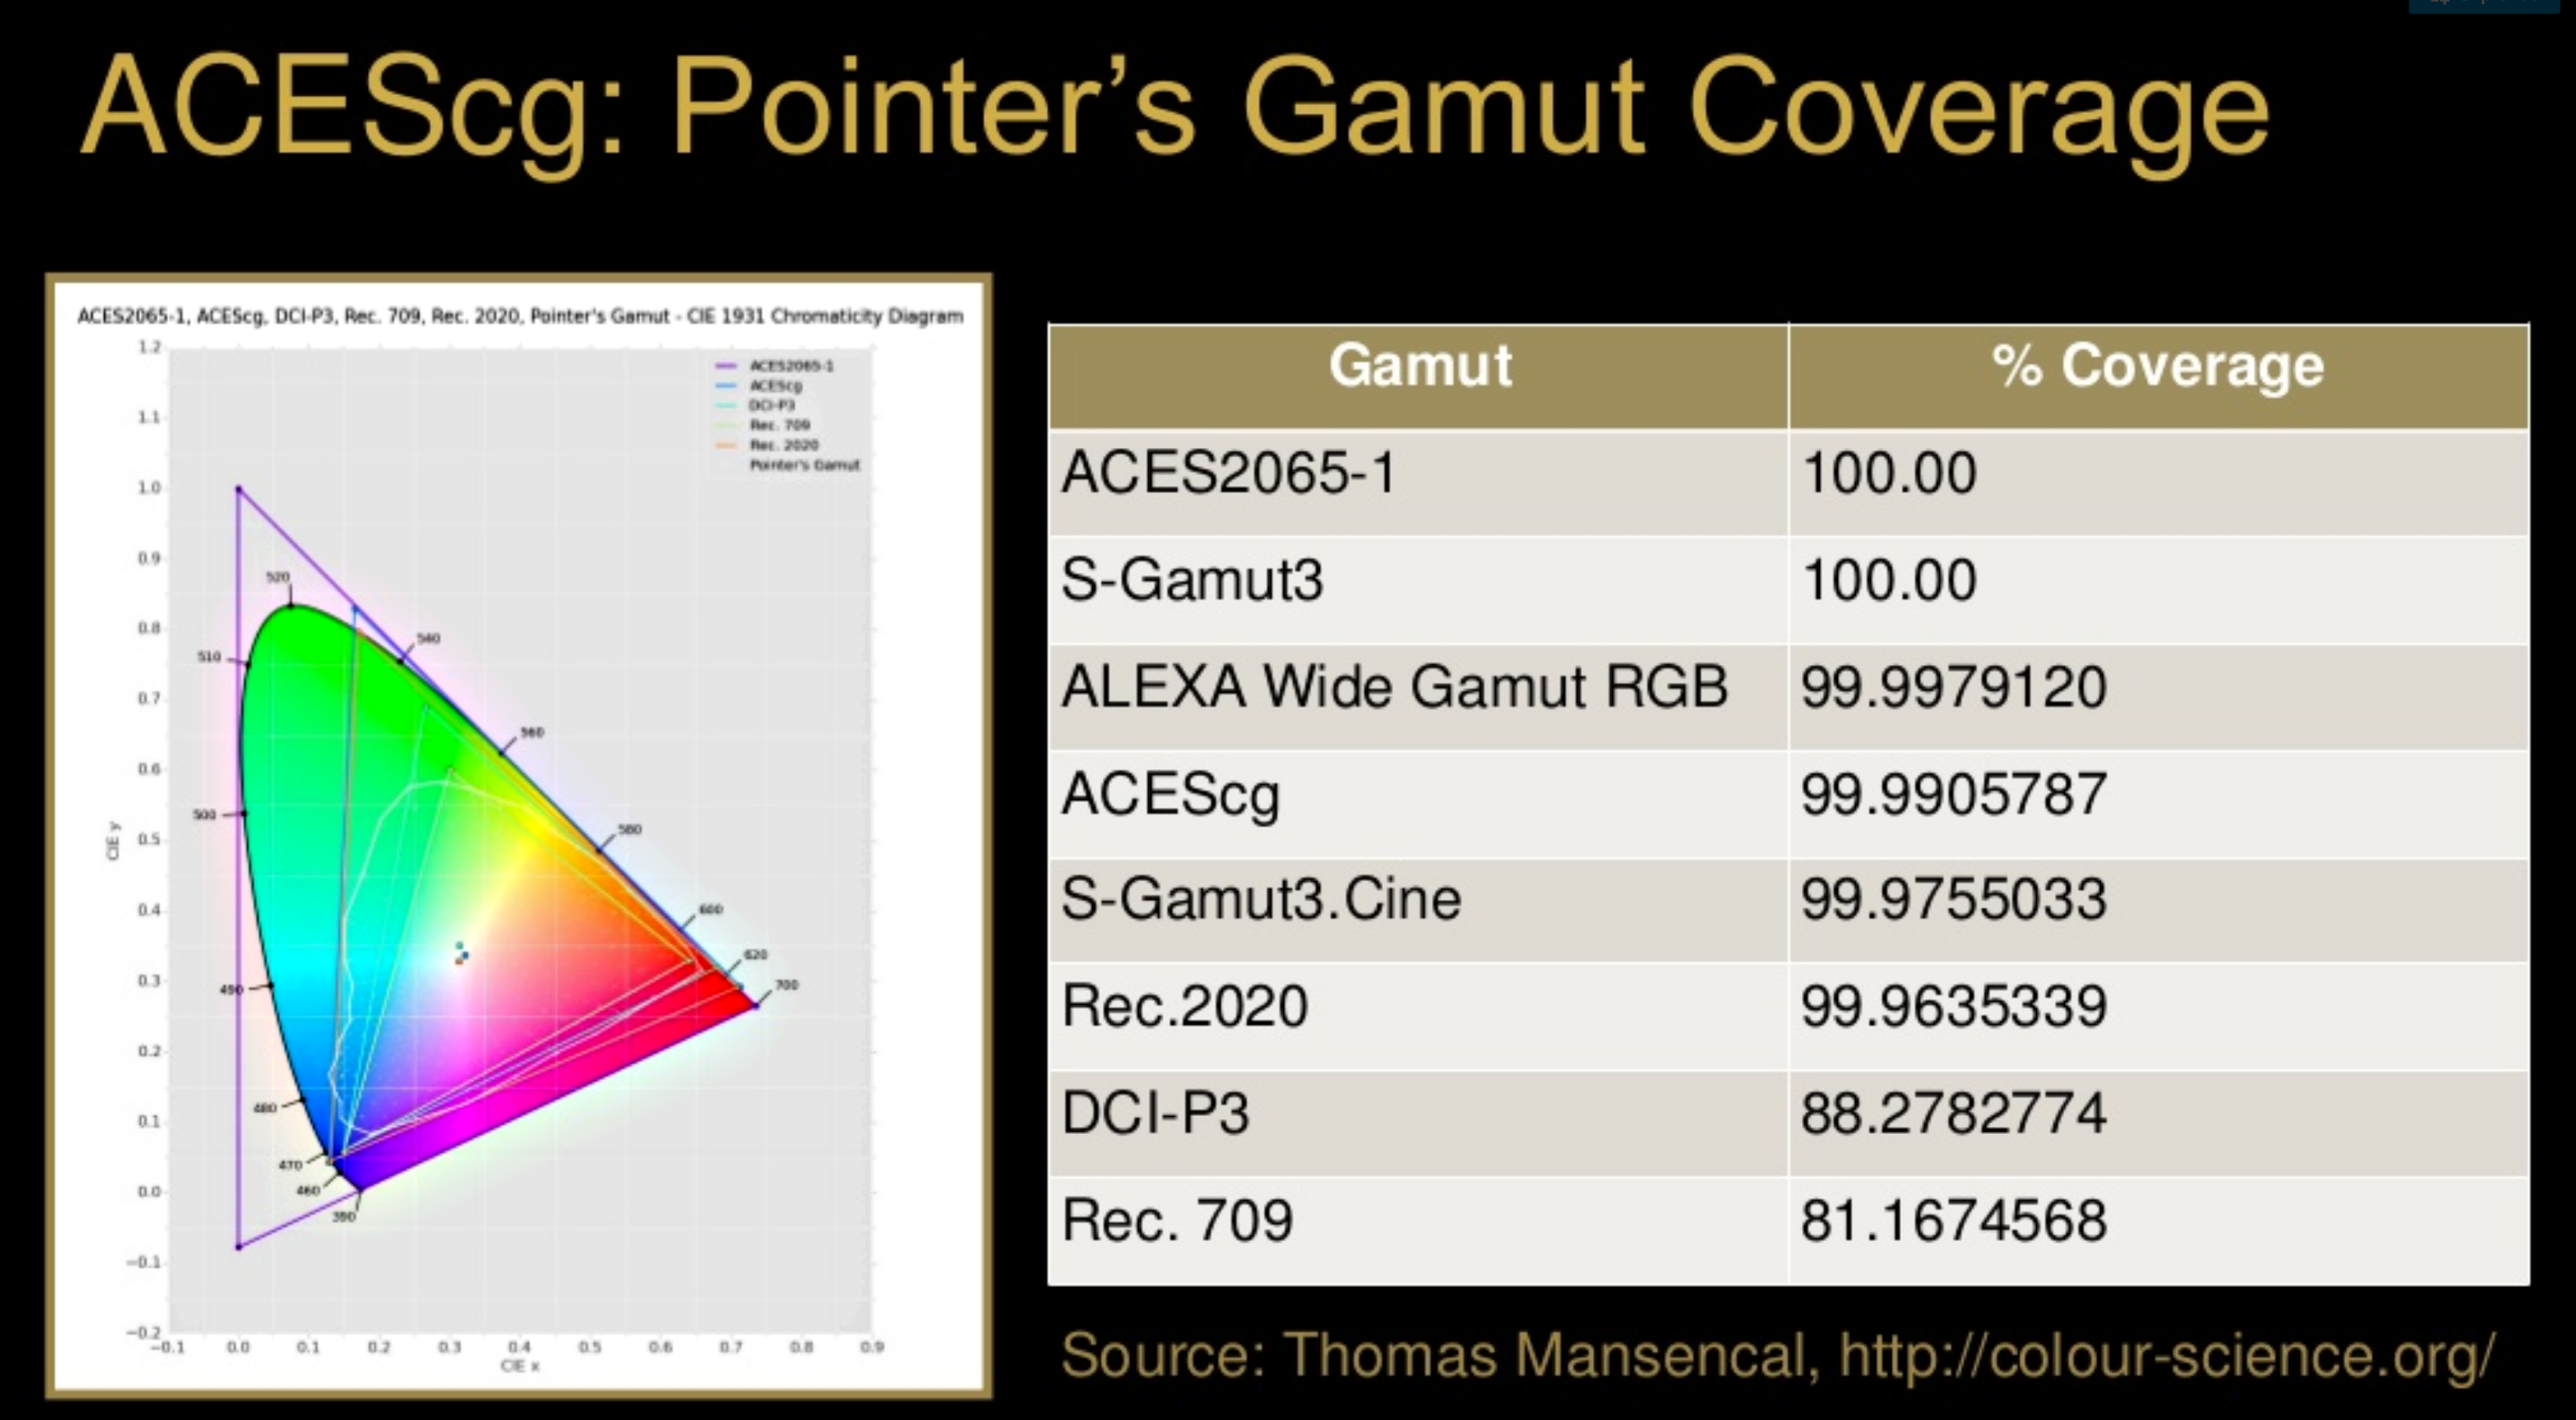
The Pointer’s gamut is (an approximation of) the gamut of real surface colors as can be seen by the human eye, based on the research by Michael R. Pointer (1980). What this means is that every color that can be reflected by the surface of an object of any material is inside the Pointer’s gamut. Basically establishing a widely respected target for color reproduction. Visually, Pointers Gamut represents the colors we see about us in the natural world. Colors outside Pointers Gamut include those that do not occur naturally, such as neon lights and computer-generated colors possible in animation. Which would partially be accounted for with the new gamuts.
cinepedia.com/picture/color-gamut/
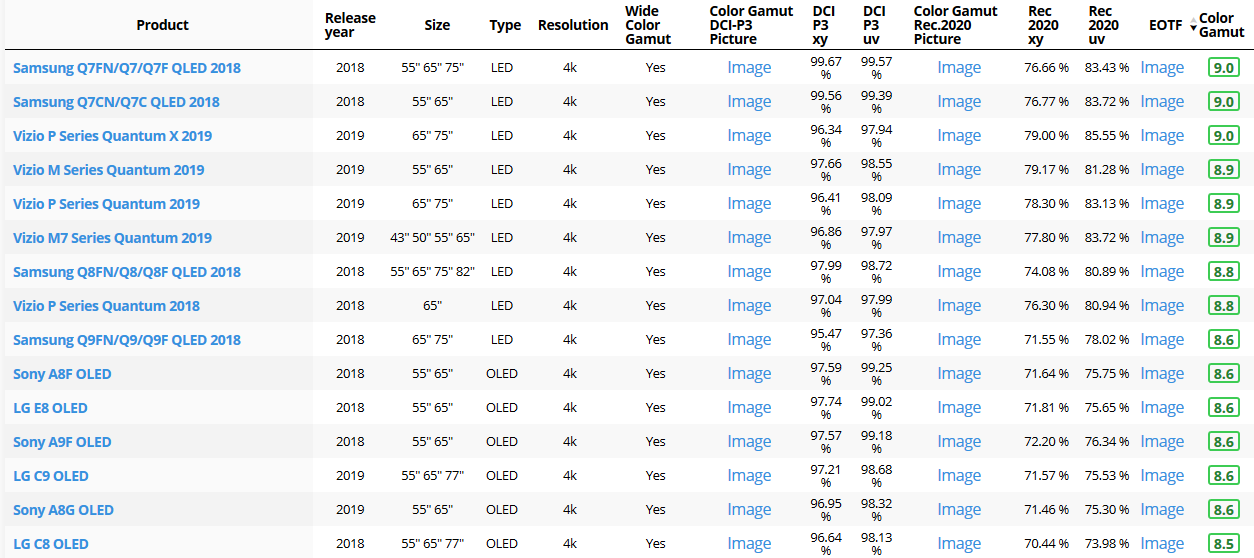
Not all current TVs can support the full spread of the new gamuts. Here is a list of modern TVs’ color coverage in percentage:
www.rtings.com/tv/tests/picture-quality/wide-color-gamut-rec-709-dci-p3-rec-2020There are no TVs that can come close to displaying all the colors within Rec.2020, and there likely won’t be for at least a few years. However, to help future-proof the technology, Rec.2020 support is already baked into the HDR spec. That means that the same genuine HDR media that fills the DCI P3 space on a compatible TV now, will in a few years also fill Rec.2020 on a TV supporting that larger space.
Rec.2020’s main gains are in the number of new tones of green that it will display, though it also offers improvements to the number of blue and red colors as well. Altogether, Rec.2020 will cover about 75% of the visual spectrum, which is a sizeable increase in coverage even over DCI P3.
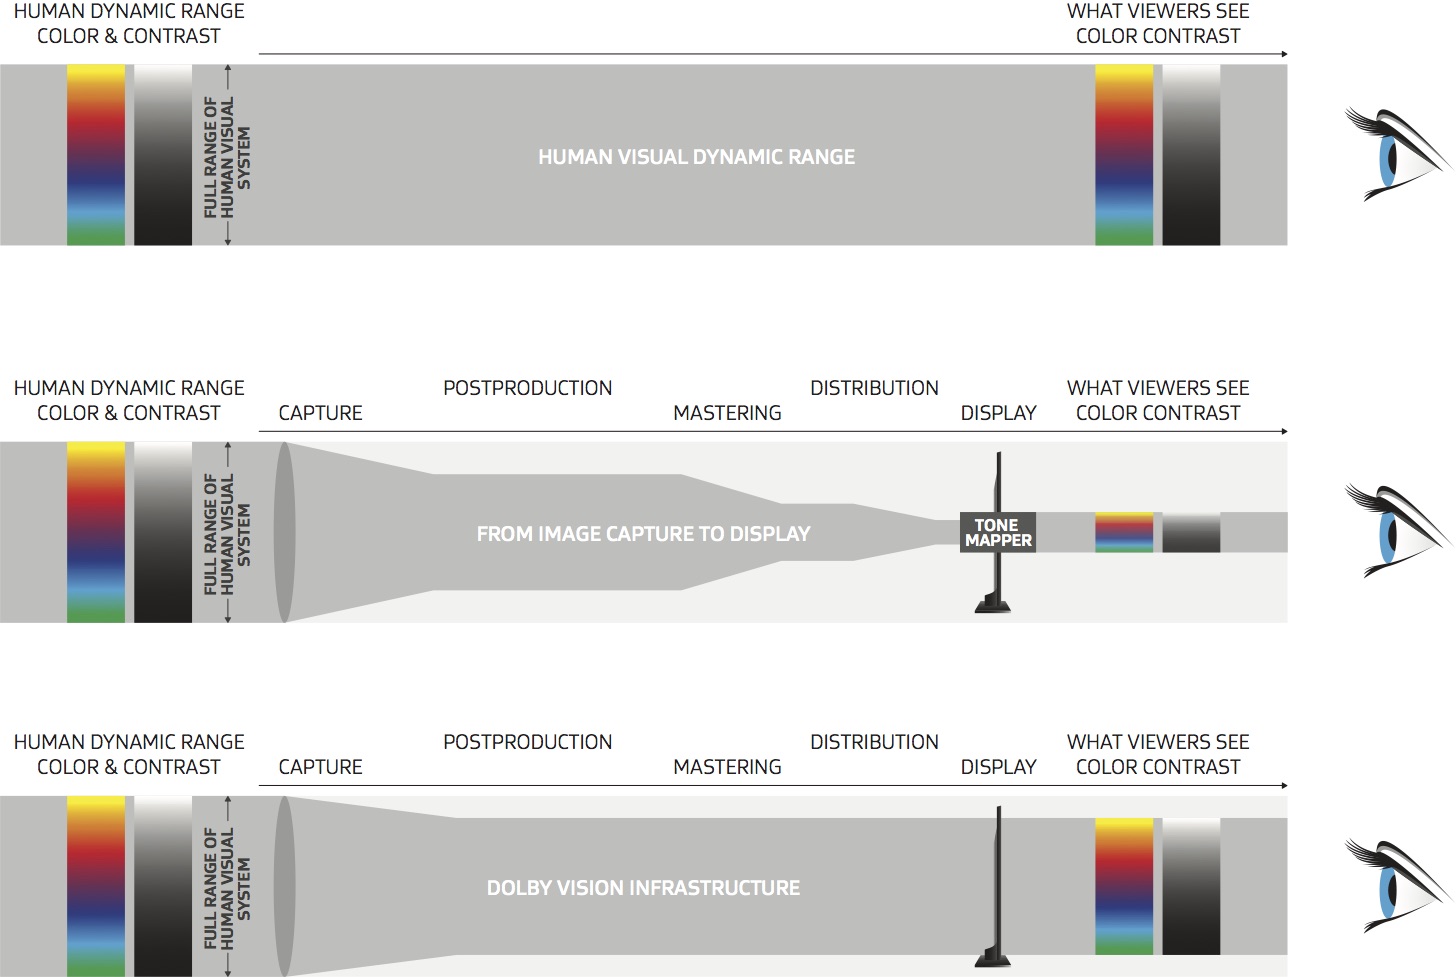
Dolby Vision
https://www.highdefdigest.com/news/show/what-is-dolby-vision/39049
https://www.techhive.com/article/3237232/dolby-vision-vs-hdr10-which-is-best.html
Dolby Vision is a proprietary end-to-end High Dynamic Range (HDR) format that covers content creation and playback through select cinemas, Ultra HD displays, and 4K titles. Like other HDR standards, the process uses expanded brightness to improve contrast between dark and light aspects of an image, bringing out deeper black levels and more realistic details in specular highlights — like the sun reflecting off of an ocean — in specially graded Dolby Vision material.
The iPhone 12 Pro gets the ability to record 4K 10-bit HDR video. According to Apple, it is the very first smartphone that is capable of capturing Dolby Vision HDR.
The iPhone 12 Pro takes two separate exposures and runs them through Apple’s custom image signal processor to create a histogram, which is a graph of the tonal values in each frame. The Dolby Vision metadata is then generated based on that histogram. In Laymen’s terms, it is essentially doing real-time grading while you are shooting. This is only possible due to the A14 Bionic chip.
Dolby Vision also allows for 12-bit color, as opposed to HDR10’s and HDR10+’s 10-bit color. While no retail TV we’re aware of supports 12-bit color, Dolby claims it can be down-sampled in such a way as to render 10-bit color more accurately.
Resources for more reading:
https://www.avsforum.com/forum/166-lcd-flat-panel-displays/2812161-what-color-volume.html
wolfcrow.com/say-hello-to-rec-2020-the-color-space-of-the-future/
www.cnet.com/news/ultra-hd-tv-color-part-ii-the-future/
-
Weta Digital – Manuka Raytracer and Gazebo GPU renderers – pipeline
Read more: Weta Digital – Manuka Raytracer and Gazebo GPU renderers – pipelinehttps://jo.dreggn.org/home/2018_manuka.pdf
http://www.fxguide.com/featured/manuka-weta-digitals-new-renderer/

The Manuka rendering architecture has been designed in the spirit of the classic reyes rendering architecture. In its core, reyes is based on stochastic rasterisation of micropolygons, facilitating depth of field, motion blur, high geometric complexity,and programmable shading.
This is commonly achieved with Monte Carlo path tracing, using a paradigm often called shade-on-hit, in which the renderer alternates tracing rays with running shaders on the various ray hits. The shaders take the role of generating the inputs of the local material structure which is then used bypath sampling logic to evaluate contributions and to inform what further rays to cast through the scene.
Over the years, however, the expectations have risen substantially when it comes to image quality. Computing pictures which are indistinguishable from real footage requires accurate simulation of light transport, which is most often performed using some variant of Monte Carlo path tracing. Unfortunately this paradigm requires random memory accesses to the whole scene and does not lend itself well to a rasterisation approach at all.
Manuka is both a uni-directional and bidirectional path tracer and encompasses multiple importance sampling (MIS). Interestingly, and importantly for production character skin work, it is the first major production renderer to incorporate spectral MIS in the form of a new ‘Hero Spectral Sampling’ technique, which was recently published at Eurographics Symposium on Rendering 2014.
Manuka propose a shade-before-hit paradigm in-stead and minimise I/O strain (and some memory costs) on the system, leveraging locality of reference by running pattern generation shaders before we execute light transport simulation by path sampling, “compressing” any bvh structure as needed, and as such also limiting duplication of source data.
The difference with reyes is that instead of baking colors into the geometry like in Reyes, manuka bakes surface closures. This means that light transport is still calculated with path tracing, but all texture lookups etc. are done up-front and baked into the geometry.The main drawback with this method is that geometry has to be tessellated to its highest, stable topology before shading can be evaluated properly. As such, the high cost to first pixel. Even a basic 4 vertices square becomes a much more complex model with this approach.

Manuka use the RenderMan Shading Language (rsl) for programmable shading [Pixar Animation Studios 2015], but we do not invoke rsl shaders when intersecting a ray with a surface (often called shade-on-hit). Instead, we pre-tessellate and pre-shade all the input geometry in the front end of the renderer.
This way, we can efficiently order shading computations to sup-port near-optimal texture locality, vectorisation, and parallelism. This system avoids repeated evaluation of shaders at the same surface point, and presents a minimal amount of memory to be accessed during light transport time. An added benefit is that the acceleration structure for ray tracing (abounding volume hierarchy, bvh) is built once on the final tessellated geometry, which allows us to ray trace more efficiently than multi-level bvhs and avoids costly caching of on-demand tessellated micropolygons and the associated scheduling issues.For the shading reasons above, in terms of AOVs, the studio approach is to succeed at combining complex shading with ray paths in the render rather than pass a multi-pass render to compositing.
For the Spectral Rendering component. The light transport stage is fully spectral, using a continuously sampled wavelength which is traced with each path and used to apply the spectral camera sensitivity of the sensor. This allows for faithfully support any degree of observer metamerism as the camera footage they are intended to match as well as complex materials which require wavelength dependent phenomena such as diffraction, dispersion, interference, iridescence, or chromatic extinction and Rayleigh scattering in participating media.
As opposed to the original reyes paper, we use bilinear interpolation of these bsdf inputs later when evaluating bsdfs per pathv ertex during light transport4. This improves temporal stability of geometry which moves very slowly with respect to the pixel raster
In terms of the pipeline, everything rendered at Weta was already completely interwoven with their deep data pipeline. Manuka very much was written with deep data in mind. Here, Manuka not so much extends the deep capabilities, rather it fully matches the already extremely complex and powerful setup Weta Digital already enjoy with RenderMan. For example, an ape in a scene can be selected, its ID is available and a NUKE artist can then paint in 3D say a hand and part of the way up the neutral posed ape.
We called our system Manuka, as a respectful nod to reyes: we had heard a story froma former ILM employee about how reyes got its name from how fond the early Pixar people were of their lunches at Point Reyes, and decided to name our system after our surrounding natural environment, too. Manuka is a kind of tea tree very common in New Zealand which has very many very small leaves, in analogy to micropolygons ina tree structure for ray tracing. It also happens to be the case that Weta Digital’s main site is on Manuka Street.

-
SecretWeapons MixBox – a practical library for paint-like digital color mixing
Read more: SecretWeapons MixBox – a practical library for paint-like digital color mixingInternally, Mixbox treats colors as real-life pigments using the Kubelka & Munk theory to predict realistic color behavior.
https://scrtwpns.com/mixbox/painter/
https://scrtwpns.com/mixbox.pdf
https://github.com/scrtwpns/mixbox
https://scrtwpns.com/mixbox/docs/


LIGHTING
-
Unity 3D resources
Read more: Unity 3D resources
http://answers.unity3d.com/questions/12321/how-can-i-start-learning-unity-fast-list-of-tutori.html
If you have no previous experience with Unity, start with these six video tutorials which give a quick overview of the Unity interface and some important features http://unity3d.com/support/documentation/video/
-
LUX vs LUMEN vs NITS vs CANDELA – What is the difference
Read more: LUX vs LUMEN vs NITS vs CANDELA – What is the differenceMore details here: Lumens vs Candelas (candle) vs Lux vs FootCandle vs Watts vs Irradiance vs Illuminance


https://www.inhouseav.com.au/blog/beginners-guide-nits-lumens-brightness/

Candela
Candela is the basic unit of measure of the entire volume of light intensity from any point in a single direction from a light source. Note the detail: it measures the total volume of light within a certain beam angle and direction.
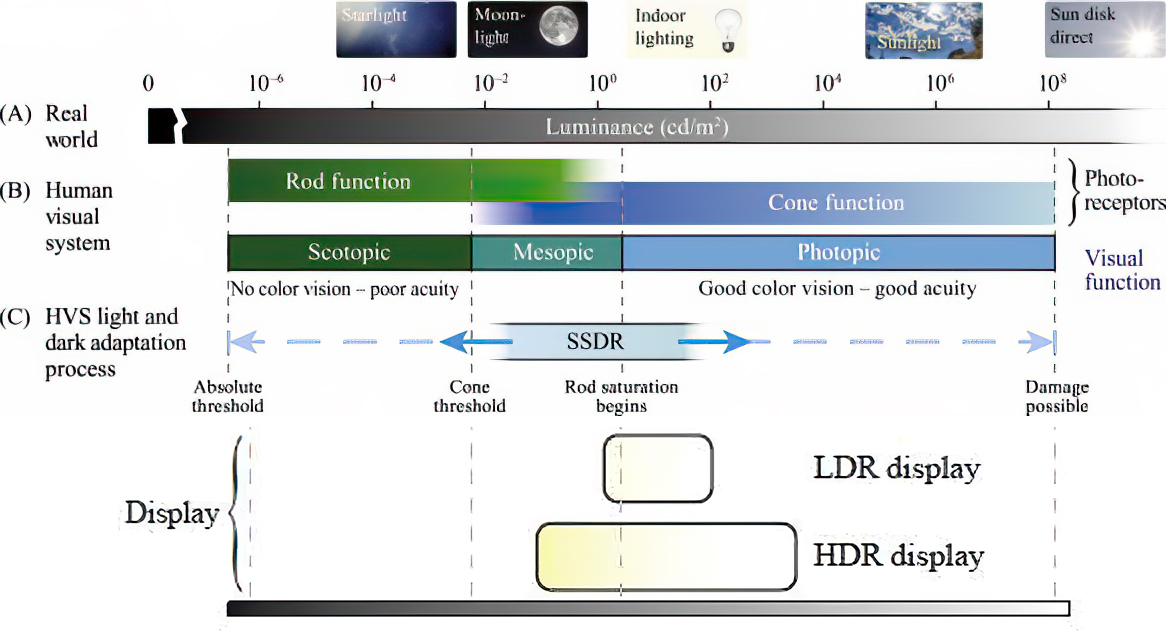
While the luminance of starlight is around 0.001 cd/m2, that of a sunlit scene is around 100,000 cd/m2, which is a hundred millions times higher. The luminance of the sun itself is approximately 1,000,000,000 cd/m2.NIT
https://en.wikipedia.org/wiki/Candela_per_square_metre
The candela per square metre (symbol: cd/m2) is the unit of luminance in the International System of Units (SI). The unit is based on the candela, the SI unit of luminous intensity, and the square metre, the SI unit of area. The nit (symbol: nt) is a non-SI name also used for this unit (1 nt = 1 cd/m2).[1] The term nit is believed to come from the Latin word nitēre, “to shine”. As a measure of light emitted per unit area, this unit is frequently used to specify the brightness of a display device.
NIT and cd/m2 (candela power) represent the same thing and can be used interchangeably. One nit is equivalent to one candela per square meter, where the candela is the amount of light which has been emitted by a common tallow candle, but NIT is not part of the International System of Units (abbreviated SI, from Systeme International, in French).
It’s easiest to think of a TV as emitting light directly, in much the same way as the Sun does. Nits are simply the measurement of the level of light (luminance) in a given area which the emitting source sends to your eyes or a camera sensor.
The Nit can be considered a unit of visible-light intensity which is often used to specify the brightness level of an LCD.
1 Nit is approximately equal to 3.426 Lumens. To work out a comparable number of Nits to Lumens, you need to multiply the number of Nits by 3.426. If you know the number of Lumens, and wish to know the Nits, simply divide the number of Lumens by 3.426.
Most consumer desktop LCDs have Nits of 200 to 300, the average TV most likely has an output capability of between 100 and 200 Nits, and an HDR TV ranges from 400 to 1,500 Nits.
Virtual Production sets currently sport around 6000 NIT ceiling and 1000 NIT wall panels.The ambient brightness of a sunny day with clear blue skies is between 7000-10,000 nits (between 3000-7000 nits for overcast skies and indirect sunlight).
A bright sunny day can have specular highlights that reach over 100,000 nits. Direct sunlight is around 1,600,000,000 nits.
10,000 nits is also the typical brightness of a fluorescent tube – bright, but not painful to look at.
https://www.displaydaily.com/article/display-daily/dolby-vision-vs-hdr10-clarified
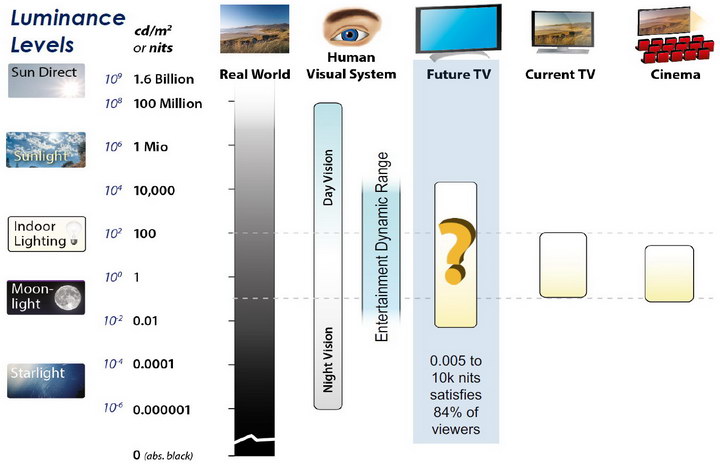
Tests showed that a “black level” of 0.005 nits (cd/m²) satisfied the vast majority of viewers. While 0.005 nits is very close to true black, Griffis says Dolby can go down to a black of 0.0001 nits, even though there is no need or ability for displays to get that dark today.
How bright is white? Dolby says the range of 0.005 nits – 10,000 nits satisfied 84% of the viewers in their viewing tests.
The brightest consumer HDR displays today are about 1,500 nits. Professional displays where HDR content is color-graded can achieve up to 4,000 nits peak brightness.High brightness that would be in danger of damaging the eye would be in the neighborhood of 250,000 nits.
Lumens
Lumen is a measure of how much light is emitted (luminance, luminous flux) by an object. It indicates the total potential amount of light from a light source that is visible to the human eye.
Lumen is commonly used in the context of light bulbs or video-projectors as a metric for their brightness power.Lumen is used to describe light output, and about video projectors, it is commonly referred to as ANSI Lumens. Simply put, lumens is how to find out how bright a LED display is. The higher the lumens, the brighter to display!
Technically speaking, a Lumen is the SI unit of luminous flux, which is equal to the amount of light which is emitted per second in a unit solid angle of one steradian from a uniform source of one-candela intensity radiating in all directions.
LUX
Lux (lx) or often Illuminance, is a photometric unit along a given area, which takes in account the sensitivity of human eye to different wavelenghts. It is the measure of light at a specific distance within a specific area at that distance. Often used to measure the incidental sun’s intensity.
-
What’s the Difference Between Ray Casting, Ray Tracing, Path Tracing and Rasterization? Physical light tracing…
Read more: What’s the Difference Between Ray Casting, Ray Tracing, Path Tracing and Rasterization? Physical light tracing…RASTERIZATION
Rasterisation (or rasterization) is the task of taking the information described in a vector graphics format OR the vertices of triangles making 3D shapes and converting them into a raster image (a series of pixels, dots or lines, which, when displayed together, create the image which was represented via shapes), or in other words “rasterizing” vectors or 3D models onto a 2D plane for display on a computer screen.For each triangle of a 3D shape, you project the corners of the triangle on the virtual screen with some math (projective geometry). Then you have the position of the 3 corners of the triangle on the pixel screen. Those 3 points have texture coordinates, so you know where in the texture are the 3 corners. The cost is proportional to the number of triangles, and is only a little bit affected by the screen resolution.
In computer graphics, a raster graphics or bitmap image is a dot matrix data structure that represents a generally rectangular grid of pixels (points of color), viewable via a monitor, paper, or other display medium.
With rasterization, objects on the screen are created from a mesh of virtual triangles, or polygons, that create 3D models of objects. A lot of information is associated with each vertex, including its position in space, as well as information about color, texture and its “normal,” which is used to determine the way the surface of an object is facing.
Computers then convert the triangles of the 3D models into pixels, or dots, on a 2D screen. Each pixel can be assigned an initial color value from the data stored in the triangle vertices.
Further pixel processing or “shading,” including changing pixel color based on how lights in the scene hit the pixel, and applying one or more textures to the pixel, combine to generate the final color applied to a pixel.
The main advantage of rasterization is its speed. However, rasterization is simply the process of computing the mapping from scene geometry to pixels and does not prescribe a particular way to compute the color of those pixels. So it cannot take shading, especially the physical light, into account and it cannot promise to get a photorealistic output. That’s a big limitation of rasterization.
There are also multiple problems:
If you have two triangles one is behind the other, you will draw twice all the pixels. you only keep the pixel from the triangle that is closer to you (Z-buffer), but you still do the work twice.
The borders of your triangles are jagged as it is hard to know if a pixel is in the triangle or out. You can do some smoothing on those, that is anti-aliasing.
You have to handle every triangles (including the ones behind you) and then see that they do not touch the screen at all. (we have techniques to mitigate this where we only look at triangles that are in the field of view)
Transparency is hard to handle (you can’t just do an average of the color of overlapping transparent triangles, you have to do it in the right order)


RAY CASTING
It is almost the exact reverse of rasterization: you start from the virtual screen instead of the vector or 3D shapes, and you project a ray, starting from each pixel of the screen, until it intersect with a triangle.The cost is directly correlated to the number of pixels in the screen and you need a really cheap way of finding the first triangle that intersect a ray. In the end, it is more expensive than rasterization but it will, by design, ignore the triangles that are out of the field of view.
You can use it to continue after the first triangle it hit, to take a little bit of the color of the next one, etc… This is useful to handle the border of the triangle cleanly (less jagged) and to handle transparency correctly.
RAYTRACING


Same idea as ray casting except once you hit a triangle you reflect on it and go into a different direction. The number of reflection you allow is the “depth” of your ray tracing. The color of the pixel can be calculated, based off the light source and all the polygons it had to reflect off of to get to that screen pixel.The easiest way to think of ray tracing is to look around you, right now. The objects you’re seeing are illuminated by beams of light. Now turn that around and follow the path of those beams backwards from your eye to the objects that light interacts with. That’s ray tracing.
Ray tracing is eye-oriented process that needs walking through each pixel looking for what object should be shown there, which is also can be described as a technique that follows a beam of light (in pixels) from a set point and simulates how it reacts when it encounters objects.
Compared with rasterization, ray tracing is hard to be implemented in real time, since even one ray can be traced and processed without much trouble, but after one ray bounces off an object, it can turn into 10 rays, and those 10 can turn into 100, 1000…The increase is exponential, and the the calculation for all these rays will be time consuming.
Historically, computer hardware hasn’t been fast enough to use these techniques in real time, such as in video games. Moviemakers can take as long as they like to render a single frame, so they do it offline in render farms. Video games have only a fraction of a second. As a result, most real-time graphics rely on the another technique called rasterization.

PATH TRACING
Path tracing can be used to solve more complex lighting situations.
Path tracing is a type of ray tracing. When using path tracing for rendering, the rays only produce a single ray per bounce. The rays do not follow a defined line per bounce (to a light, for example), but rather shoot off in a random direction. The path tracing algorithm then takes a random sampling of all of the rays to create the final image. This results in sampling a variety of different types of lighting.When a ray hits a surface it doesn’t trace a path to every light source, instead it bounces the ray off the surface and keeps bouncing it until it hits a light source or exhausts some bounce limit.
It then calculates the amount of light transferred all the way to the pixel, including any color information gathered from surfaces along the way.
It then averages out the values calculated from all the paths that were traced into the scene to get the final pixel color value.It requires a ton of computing power and if you don’t send out enough rays per pixel or don’t trace the paths far enough into the scene then you end up with a very spotty image as many pixels fail to find any light sources from their rays. So when you increase the the samples per pixel, you can see the image quality becomes better and better.
Ray tracing tends to be more efficient than path tracing. Basically, the render time of a ray tracer depends on the number of polygons in the scene. The more polygons you have, the longer it will take.
Meanwhile, the rendering time of a path tracer can be indifferent to the number of polygons, but it is related to light situation: If you add a light, transparency, translucence, or other shader effects, the path tracer will slow down considerably.
blogs.nvidia.com/blog/2018/03/19/whats-difference-between-ray-tracing-rasterization/
https://en.wikipedia.org/wiki/Rasterisation
https://www.quora.com/Whats-the-difference-between-ray-tracing-and-path-tracing
-
Photography basics: Exposure Value vs Photographic Exposure vs Il/Luminance vs Pixel luminance measurements
Read more: Photography basics: Exposure Value vs Photographic Exposure vs Il/Luminance vs Pixel luminance measurementsAlso see: https://www.pixelsham.com/2015/05/16/how-aperture-shutter-speed-and-iso-affect-your-photos/
In photography, exposure value (EV) is a number that represents a combination of a camera’s shutter speed and f-number, such that all combinations that yield the same exposure have the same EV (for any fixed scene luminance).

The EV concept was developed in an attempt to simplify choosing among combinations of equivalent camera settings. Although all camera settings with the same EV nominally give the same exposure, they do not necessarily give the same picture. EV is also used to indicate an interval on the photographic exposure scale. 1 EV corresponding to a standard power-of-2 exposure step, commonly referred to as a stop
EV 0 corresponds to an exposure time of 1 sec and a relative aperture of f/1.0. If the EV is known, it can be used to select combinations of exposure time and f-number.
Note EV does not equal to photographic exposure. Photographic Exposure is defined as how much light hits the camera’s sensor. It depends on the camera settings mainly aperture and shutter speed. Exposure value (known as EV) is a number that represents the exposure setting of the camera.
Thus, strictly, EV is not a measure of luminance (indirect or reflected exposure) or illuminance (incidental exposure); rather, an EV corresponds to a luminance (or illuminance) for which a camera with a given ISO speed would use the indicated EV to obtain the nominally correct exposure. Nonetheless, it is common practice among photographic equipment manufacturers to express luminance in EV for ISO 100 speed, as when specifying metering range or autofocus sensitivity.
The exposure depends on two things: how much light gets through the lenses to the camera’s sensor and for how long the sensor is exposed. The former is a function of the aperture value while the latter is a function of the shutter speed. Exposure value is a number that represents this potential amount of light that could hit the sensor. It is important to understand that exposure value is a measure of how exposed the sensor is to light and not a measure of how much light actually hits the sensor. The exposure value is independent of how lit the scene is. For example a pair of aperture value and shutter speed represents the same exposure value both if the camera is used during a very bright day or during a dark night.
Each exposure value number represents all the possible shutter and aperture settings that result in the same exposure. Although the exposure value is the same for different combinations of aperture values and shutter speeds the resulting photo can be very different (the aperture controls the depth of field while shutter speed controls how much motion is captured).
EV 0.0 is defined as the exposure when setting the aperture to f-number 1.0 and the shutter speed to 1 second. All other exposure values are relative to that number. Exposure values are on a base two logarithmic scale. This means that every single step of EV – plus or minus 1 – represents the exposure (actual light that hits the sensor) being halved or doubled.
https://www.streetdirectory.com/travel_guide/141307/photography/exposure_value_ev_and_exposure_compensation.html
Formula
https://en.wikipedia.org/wiki/Exposure_value
https://www.scantips.com/lights/math.html

which means 2EV = N² / t
where
- N is the relative aperture (f-number) Important: Note that f/stop values must first be squared in most calculations
- t is the exposure time (shutter speed) in seconds
EV 0 corresponds to an exposure time of 1 sec and an aperture of f/1.0.
Example: If f/16 and 1/4 second, then this is:
(N² / t) = (16 × 16 ÷ 1/4) = (16 × 16 × 4) = 1024.
Log₂(1024) is EV 10. Meaning, 210 = 1024.
Collecting photographic exposure using Light Meters
The exposure meter in the camera does not know whether the subject itself is bright or not. It simply measures the amount of light that comes in, and makes a guess based on that. The camera will aim for 18% gray, meaning if you take a photo of an entirely white surface, and an entirely black surface you should get two identical images which both are gray (at least in theory)
https://en.wikipedia.org/wiki/Light_meter
For reflected-light meters, camera settings are related to ISO speed and subject luminance by the reflected-light exposure equation:

where
- N is the relative aperture (f-number)
- t is the exposure time (“shutter speed”) in seconds
- L is the average scene luminance
- S is the ISO arithmetic speed
- K is the reflected-light meter calibration constant
For incident-light meters, camera settings are related to ISO speed and subject illuminance by the incident-light exposure equation:

where
- E is the illuminance (in lux)
- C is the incident-light meter calibration constant
Two values for K are in common use: 12.5 (Canon, Nikon, and Sekonic) and 14 (Minolta, Kenko, and Pentax); the difference between the two values is approximately 1/6 EV.
For C a value of 250 is commonly used.Nonetheless, it is common practice among photographic equipment manufacturers to also express luminance in EV for ISO 100 speed. Using K = 12.5, the relationship between EV at ISO 100 and luminance L is then :
L = 2(EV-3)
The situation with incident-light meters is more complicated than that for reflected-light meters, because the calibration constant C depends on the sensor type. Illuminance is measured with a flat sensor; a typical value for C is 250 with illuminance in lux. Using C = 250, the relationship between EV at ISO 100 and illuminance E is then :
E = 2.5 * 2(EV)
https://nofilmschool.com/2018/03/want-easier-and-faster-way-calculate-exposure-formula
Three basic factors go into the exposure formula itself instead: aperture, shutter, and ISO. Plus a light meter calibration constant.
f-stop²/shutter (in seconds) = lux * ISO/C
If you at least know four of those variables, you’ll be able to calculate the missing value.
So, say you want to figure out how much light you’re going to need in order to shoot at a certain f-stop. Well, all you do is plug in your values (you should know the f-stop, ISO, and your light meter calibration constant) into the formula below:
lux = C (f-stop²/shutter (in seconds))/ISO
Exposure Value Calculator:
https://snapheadshots.com/resources/exposure-and-light-calculator
https://www.scantips.com/lights/exposurecalc.html
https://www.pointsinfocus.com/tools/exposure-settings-ev-calculator/#google_vignette
From that perspective, an exposure stop is a measurement of Exposure and provides a universal linear scale to measure the increase and decrease in light, exposed to the image sensor, due to changes in shutter speed, iso & f-stop.
+-1 stop is a doubling or halving of the amount of light let in when taking a photo.
1 EV is just another way to say one stop of exposure change.One major use of EV (Exposure Value) is just to measure any change of exposure, where one EV implies a change of one stop of exposure. Like when we compensate our picture in the camera.
If the picture comes out too dark, our manual exposure could correct the next one by directly adjusting one of the three exposure controls (f/stop, shutter speed, or ISO). Or if using camera automation, the camera meter is controlling it, but we might apply +1 EV exposure compensation (or +1 EV flash compensation) to make the result goal brighter, as desired. This use of 1 EV is just another way to say one stop of exposure change.
On a perfect day the difference from sampling the sky vs the sun exposure with diffusing spot meters is about 3.2 exposure difference.
 ~15.4 EV for the sun
 ~12.2 EV for the sky
That is as a ballpark. All still influenced by surroundings, accuracy parameters, fov of the sensor…


EV calculator
https://www.scantips.com/lights/evchart.html#calc
http://www.fredparker.com/ultexp1.htm
Exposure value is basically used to indicate an interval on the photographic exposure scale, with a difference of 1 EV corresponding to a standard power-of-2 exposure step, also commonly referred to as a “stop”.
https://contrastly.com/a-guide-to-understanding-exposure-value-ev/
Retrieving photographic exposure from an image
All you can hope to measure with your camera and some images is the relative reflected luminance. Even if you have the camera settings. https://en.wikipedia.org/wiki/Relative_luminance
If you REALLY want to know the amount of light in absolute radiometric units, you’re going to need to use some kind of absolute light meter or measured light source to calibrate your camera. For references on how to do this, see: Section 2.5 Obtaining Absolute Radiance from http://www.pauldebevec.com/Research/HDR/debevec-siggraph97.pdf
IF you are still trying to gauge relative brightness, the level of the sun in Nuke can vary, but it should be in the thousands. Ie: between 30,000 and 65,0000 rgb value depending on time of the day, season and atmospherics.
The values for a 12 o’clock sun, with the sun sampled at EV 15.5 (shutter 1/30, ISO 100, F22) is 32.000 RGB max values (or 32,000 pixel luminance).
The thing to keep an eye for is the level of contrast between sunny side/fill side. The terminator should be quite obvious, there can be up to 3 stops difference between fill/key in sunny lit objects.Note: In Foundry’s Nuke, the software will map 18% gray to whatever your center f/stop is set to in the viewer settings (f/8 by default… change that to EV by following the instructions below).
You can experiment with this by attaching an Exposure node to a Constant set to 0.18, setting your viewer read-out to Spotmeter, and adjusting the stops in the node up and down. You will see that a full stop up or down will give you the respective next value on the aperture scale (f8, f11, f16 etc.).
One stop doubles or halves the amount or light that hits the filmback/ccd, so everything works in powers of 2.
So starting with 0.18 in your constant, you will see that raising it by a stop will give you .36 as a floating point number (in linear space), while your f/stop will be f/11 and so on.If you set your center stop to 0 (see below) you will get a relative readout in EVs, where EV 0 again equals 18% constant gray.
Note: make sure to set your Nuke read node to ‘raw data’
In other words. Setting the center f-stop to 0 means that in a neutral plate, the middle gray in the macbeth chart will equal to exposure value 0. EV 0 corresponds to an exposure time of 1 sec and an aperture of f/1.0.
To switch Foundry’s Nuke’s SpotMeter to return the EV of an image, click on the main viewport, and then press s, this opens the viewer’s properties. Now set the center f-stop to 0 in there. And the SpotMeter in the viewport will change from aperture and fstops to EV.
If you are trying to gauge the EV from the pixel luminance in the image:
– Setting the center f-stop to 0 means that in a neutral plate, the middle 18% gray will equal to exposure value 0.
– So if EV 0 = 0.18 middle gray in nuke which equal to a pixel luminance of 0.18, doubling that value, doubles the EV..18 pixel luminance = 0EV .36 pixel luminance = 1EV .72 pixel luminance = 2EV 1.46 pixel luminance = 3EV ...
This is a Geometric Progression function: xn = ar(n-1)
The most basic example of this function is 1,2,4,8,16,32,… The sequence starts at 1 and doubles each time, so
- a=1 (the first term)
- r=2 (the “common ratio” between terms is a doubling)
And we get:
{a, ar, ar2, ar3, … }
= {1, 1×2, 1×22, 1×23, … }
= {1, 2, 4, 8, … }
In this example the function translates to: n = 2(n-1)
You can graph this curve through this expression: x = 2(y-1) :
You can go back and forth between the two values through a geometric progression function and a log function:
(Note: in a spreadsheet this is: = POWER(2; cell# -1) and =LOG(cell#, 2)+1) )
2(y-1) log2(x)+1 x y 1 1 2 2 4 3 8 4 16 5 32 6 64 7 128 8 256 9 512 10 1024 11 2048 12 4096 13 Translating this into a geometric progression between an image pixel luminance and EV:
-
Romain Chauliac – LightIt a lighting script for Maya and Arnold
Read more: Romain Chauliac – LightIt a lighting script for Maya and ArnoldLightIt is a script for Maya and Arnold that will help you and improve your lighting workflow.
Thanks to preset studio lighting components (lights, backdrop…), high quality studio scenes and HDRI library manager.
https://www.artstation.com/artwork/393emJ
-
Sun cone angle (angular diameter) as perceived by earth viewers
Read more: Sun cone angle (angular diameter) as perceived by earth viewersAlso see:
https://www.pixelsham.com/2020/08/01/solid-angle-measures/
The cone angle of the sun refers to the angular diameter of the sun as observed from Earth, which is related to the apparent size of the sun in the sky.
The angular diameter of the sun, or the cone angle of the sunlight as perceived from Earth, is approximately 0.53 degrees on average. This value can vary slightly due to the elliptical nature of Earth’s orbit around the sun, but it generally stays within a narrow range.
Here’s a more precise breakdown:
-
- Average Angular Diameter: About 0.53 degrees (31 arcminutes)
- Minimum Angular Diameter: Approximately 0.52 degrees (when Earth is at aphelion, the farthest point from the sun)
- Maximum Angular Diameter: Approximately 0.54 degrees (when Earth is at perihelion, the closest point to the sun)
This angular diameter remains relatively constant throughout the day because the sun’s distance from Earth does not change significantly over a single day.
To summarize, the cone angle of the sun’s light, or its angular diameter, is typically around 0.53 degrees, regardless of the time of day.
https://en.wikipedia.org/wiki/Angular_diameter

-


COLLECTIONS
| Featured AI
| Design And Composition
| Explore posts
POPULAR SEARCHES
unreal | pipeline | virtual production | free | learn | photoshop | 360 | macro | google | nvidia | resolution | open source | hdri | real-time | photography basics | nuke
FEATURED POSTS
-
How do LLMs like ChatGPT (Generative Pre-Trained Transformer) work? Explained by Deep-Fake Ryan Gosling
-
Ross Pettit on The Agile Manager – How tech firms went for prioritizing cash flow instead of talent
-
Godot Cheat Sheets
-
Blender VideoDepthAI – Turn any video into 3D Animated Scenes
-
Jesse Zumstein – Jobs in games
-
59 AI Filmmaking Tools For Your Workflow
-
N8N.io – From Zero to Your First AI Agent in 25 Minutes
-
What the Boeing 737 MAX’s crashes can teach us about production business – the effects of commoditisation
Social Links
DISCLAIMER – Links and images on this website may be protected by the respective owners’ copyright. All data submitted by users through this site shall be treated as freely available to share.
