slowmoVideo is an OpenSource program that creates slow-motion videos from your footage.
Slow motion cinematography is the result of playing back frames for a longer duration than they were exposed. For example, if you expose 240 frames of film in one second, then play them back at 24 fps, the resulting movie is 10 times longer (slower) than the original filmed event….
Film cameras are relatively simple mechanical devices that allow you to crank up the speed to whatever rate the shutter and pull-down mechanism allow. Some film cameras can operate at 2,500 fps or higher (although film shot in these cameras often needs some readjustment in postproduction). Video, on the other hand, is always captured, recorded, and played back at a fixed rate, with a current limit around 60fps. This makes extreme slow motion effects harder to achieve (and less elegant) on video, because slowing down the video results in each frame held still on the screen for a long time, whereas with high-frame-rate film there are plenty of frames to fill the longer durations of time. On video, the slow motion effect is more like a slide show than smooth, continuous motion.
One obvious solution is to shoot film at high speed, then transfer it to video (a case where film still has a clear advantage, sorry George). Another possibility is to cross dissolve or blur from one frame to the next. This adds a smooth transition from one still frame to the next. The blur reduces the sharpness of the image, and compared to slowing down images shot at a high frame rate, this is somewhat of a cheat. However, there isn’t much you can do about it until video can be recorded at much higher rates. Of course, many film cameras can’t shoot at high frame rates either, so the whole super-slow-motion endeavor is somewhat specialized no matter what medium you are using. (There are some high speed digital cameras available now that allow you to capture lots of digital frames directly to your computer, so technology is starting to catch up with film. However, this feature isn’t going to appear in consumer camcorders any time soon.)
Hand drawn sketch | Models made in CC4 with ZBrush | Textures in Substance Painter | Paint over in Photoshop | Renders, Animation, VFX with AI. Each 5-8 hours spread over a couple days.
As I continue to explore the use of AI tools to enhance my 3D character creation process, I discover they can be incredibly useful during the previsualization phase to see what a character might ultimately look like in production. I selectively use AI to enhance and accelerate my creative process, not to replace it or use it as an end to end solution.
A panoramic canvas measuring 402 feet (122 meters) around and 45 feet (13.7 meters) high. It contained over 5,000 life-size portraits of war heroes, royalty and government officials from the Allies of World War I.
The Manuka rendering architecture has been designed in the spirit of the classic reyes rendering architecture. In its core, reyes is based on stochastic rasterisation of micropolygons, facilitating depth of field, motion blur, high geometric complexity,and programmable shading.
This is commonly achieved with Monte Carlo path tracing, using a paradigm often called shade-on-hit, in which the renderer alternates tracing rays with running shaders on the various ray hits. The shaders take the role of generating the inputs of the local material structure which is then used bypath sampling logic to evaluate contributions and to inform what further rays to cast through the scene.
Over the years, however, the expectations have risen substantially when it comes to image quality. Computing pictures which are indistinguishable from real footage requires accurate simulation of light transport, which is most often performed using some variant of Monte Carlo path tracing. Unfortunately this paradigm requires random memory accesses to the whole scene and does not lend itself well to a rasterisation approach at all.
Manuka is both a uni-directional and bidirectional path tracer and encompasses multiple importance sampling (MIS). Interestingly, and importantly for production character skin work, it is the first major production renderer to incorporate spectral MIS in the form of a new ‘Hero Spectral Sampling’ technique, which was recently published at Eurographics Symposium on Rendering 2014.
Manuka propose a shade-before-hit paradigm in-stead and minimise I/O strain (and some memory costs) on the system, leveraging locality of reference by running pattern generation shaders before we execute light transport simulation by path sampling, “compressing” any bvh structure as needed, and as such also limiting duplication of source data.
The difference with reyes is that instead of baking colors into the geometry like in Reyes, manuka bakes surface closures. This means that light transport is still calculated with path tracing, but all texture lookups etc. are done up-front and baked into the geometry.
The main drawback with this method is that geometry has to be tessellated to its highest, stable topology before shading can be evaluated properly. As such, the high cost to first pixel. Even a basic 4 vertices square becomes a much more complex model with this approach.
Manuka use the RenderMan Shading Language (rsl) for programmable shading [Pixar Animation Studios 2015], but we do not invoke rsl shaders when intersecting a ray with a surface (often called shade-on-hit). Instead, we pre-tessellate and pre-shade all the input geometry in the front end of the renderer.
This way, we can efficiently order shading computations to sup-port near-optimal texture locality, vectorisation, and parallelism. This system avoids repeated evaluation of shaders at the same surface point, and presents a minimal amount of memory to be accessed during light transport time. An added benefit is that the acceleration structure for ray tracing (abounding volume hierarchy, bvh) is built once on the final tessellated geometry, which allows us to ray trace more efficiently than multi-level bvhs and avoids costly caching of on-demand tessellated micropolygons and the associated scheduling issues.
For the shading reasons above, in terms of AOVs, the studio approach is to succeed at combining complex shading with ray paths in the render rather than pass a multi-pass render to compositing.
For the Spectral Rendering component. The light transport stage is fully spectral, using a continuously sampled wavelength which is traced with each path and used to apply the spectral camera sensitivity of the sensor. This allows for faithfully support any degree of observer metamerism as the camera footage they are intended to match as well as complex materials which require wavelength dependent phenomena such as diffraction, dispersion, interference, iridescence, or chromatic extinction and Rayleigh scattering in participating media.
As opposed to the original reyes paper, we use bilinear interpolation of these bsdf inputs later when evaluating bsdfs per pathv ertex during light transport4. This improves temporal stability of geometry which moves very slowly with respect to the pixel raster
In terms of the pipeline, everything rendered at Weta was already completely interwoven with their deep data pipeline. Manuka very much was written with deep data in mind. Here, Manuka not so much extends the deep capabilities, rather it fully matches the already extremely complex and powerful setup Weta Digital already enjoy with RenderMan. For example, an ape in a scene can be selected, its ID is available and a NUKE artist can then paint in 3D say a hand and part of the way up the neutral posed ape.
We called our system Manuka, as a respectful nod to reyes: we had heard a story froma former ILM employee about how reyes got its name from how fond the early Pixar people were of their lunches at Point Reyes, and decided to name our system after our surrounding natural environment, too. Manuka is a kind of tea tree very common in New Zealand which has very many very small leaves, in analogy to micropolygons ina tree structure for ray tracing. It also happens to be the case that Weta Digital’s main site is on Manuka Street.
In HD we often refer to the range of available colors as a color gamut. Such a color gamut is typically plotted on a two-dimensional diagram, called a CIE chart, as shown in at the top of this blog. Each color is characterized by its x/y coordinates.
Good enough for government work, perhaps. But for HDR, with its higher luminance levels and wider color, the gamut becomes three-dimensional.
For HDR the color gamut therefore becomes a characteristic we now call the color volume. It isn’t easy to show color volume on a two-dimensional medium like the printed page or a computer screen, but one method is shown below. As the luminance becomes higher, the picture eventually turns to white. As it becomes darker, it fades to black. The traditional color gamut shown on the CIE chart is simply a slice through this color volume at a selected luminance level, such as 50%.
Three different color volumes—we still refer to them as color gamuts though their third dimension is important—are currently the most significant. The first is BT.709 (sometimes referred to as Rec.709), the color gamut used for pre-UHD/HDR formats, including standard HD.
The largest is known as BT.2020; it encompasses (roughly) the range of colors visible to the human eye (though ET might find it insufficient!).
Between these two is the color gamut used in digital cinema, known as DCI-P3.
The human eye perceives half scene brightness not as the linear 50% of the present energy (linear nature values) but as 18% of the overall brightness. We are biased to perceive more information in the dark and contrast areas. A Macbeth chart helps with calibrating back into a photographic capture into this “human perspective” of the world.
In photography, painting, and other visual arts, middle gray or middle grey is a tone that is perceptually about halfway between black and white on a lightness scale in photography and printing, it is typically defined as 18% reflectance in visible light
Light meters, cameras, and pictures are often calibrated using an 18% gray card[4][5][6] or a color reference card such as a ColorChecker. On the assumption that 18% is similar to the average reflectance of a scene, a grey card can be used to estimate the required exposure of the film.
The exposure meter in the camera does not know whether the subject itself is bright or not. It simply measures the amount of light that comes in, and makes a guess based on that. The camera will aim for 18% gray independently, meaning if you take a photo of an entirely white surface, and an entirely black surface you should get two identical images which both are gray (at least in theory). Thus enters the Macbeth chart.
<!–more–>
Note that Chroma Key Green is reasonably close to an 18% gray reflectance.
A light wave that is vibrating in more than one plane is referred to as unpolarized light. …
Polarized light waves are light waves in which the vibrations occur in a single plane. The process of transforming unpolarized light into polarized light is known as polarization.
The most common use of polarized technology is to reduce lighting complexity on the subject. Details such as glare and hard edges are not removed, but greatly reduced.
This method is usually used in VFX to capture raw images with the least amount of specular diffusion or pollution, thus allowing artists to infer detail back through typical shading and rendering techniques and on demand.
Light reflected from a non-metallic surface becomes polarized; this effect is maximum at Brewster’s angle, about 56° from the vertical for common glass.
A polarizer rotated to pass only light polarized in the direction perpendicular to the reflected light will absorb much of it. This absorption allows glare reflected from, for example, a body of water or a road to be reduced. Reflections from shiny surfaces (e.g. vegetation, sweaty skin, water surfaces, glass) are also reduced. This allows the natural color and detail of what is beneath to come through. Reflections from a window into a dark interior can be much reduced, allowing it to be seen through. (The same effects are available for vision by using polarizing sunglasses.)
Some of the light coming from the sky is polarized (bees use this phenomenon for navigation). The electrons in the air molecules cause a scattering of sunlight in all directions. This explains why the sky is not dark during the day. But when looked at from the sides, the light emitted from a specific electron is totally polarized.[3] Hence, a picture taken in a direction at 90 degrees from the sun can take advantage of this polarization.
Use of a polarizing filter, in the correct direction, will filter out the polarized component of skylight, darkening the sky; the landscape below it, and clouds, will be less affected, giving a photograph with a darker and more dramatic sky, and emphasizing the clouds.
There are two types of polarizing filters readily available, linear and “circular”, which have exactly the same effect photographically. But the metering and auto-focus sensors in certain cameras, including virtually all auto-focus SLRs, will not work properly with linear polarizers because the beam splitters used to split off the light for focusing and metering are polarization-dependent.
Polarizing filters reduce the light passed through to the film or sensor by about one to three stops (2–8×) depending on how much of the light is polarized at the filter angle selected. Auto-exposure cameras will adjust for this by widening the aperture, lengthening the time the shutter is open, and/or increasing the ASA/ISO speed of the camera.
Neutral Density (ND) filters help control image exposure by reducing the light that enters the camera so that you can have more control of your depth of field and shutter speed. Polarizers or polarizing filters work in a similar way, but the difference is that they selectively let light waves of a certain polarization pass through. This effect helps create more vivid colors in an image, as well as manage glare and reflections from water surfaces. Both are regarded as some of the best filters for landscape and travel photography as they reduce the dynamic range in high-contrast images, thus enabling photographers to capture more realistic and dramatic sceneries.
The only required dependency is oiiotool. However other “debayer engines” are also supported.
OpenImageIO – oiiotool is used for converting debayered tif images to exr.
Debayer Engines
RawTherapee – Powerful raw development software used to decode raw images. High quality, good selection of debayer algorithms, and more advanced raw processing like chromatic aberration removal.
LibRaw – dcraw_emu commandline utility included with LibRaw. Optional alternative for debayer. Simple, fast and effective.
Darktable – Uses darktable-cli plus an xmp config to process.
vkdt – uses vkdt-cli to debayer. Pretty experimental still. Uses Vulkan for image processing. Stupidly fast. Pretty limited.
“Not every light performs the same way. Lights and lighting are tricky to handle. You have to plan for every circumstance. But the good news is, lighting can be adjusted. Let’s look at different factors that affect lighting in every scene you shoot. ”
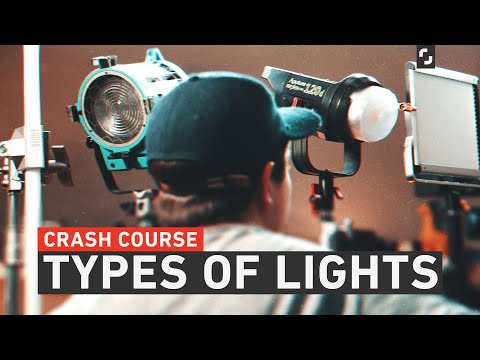
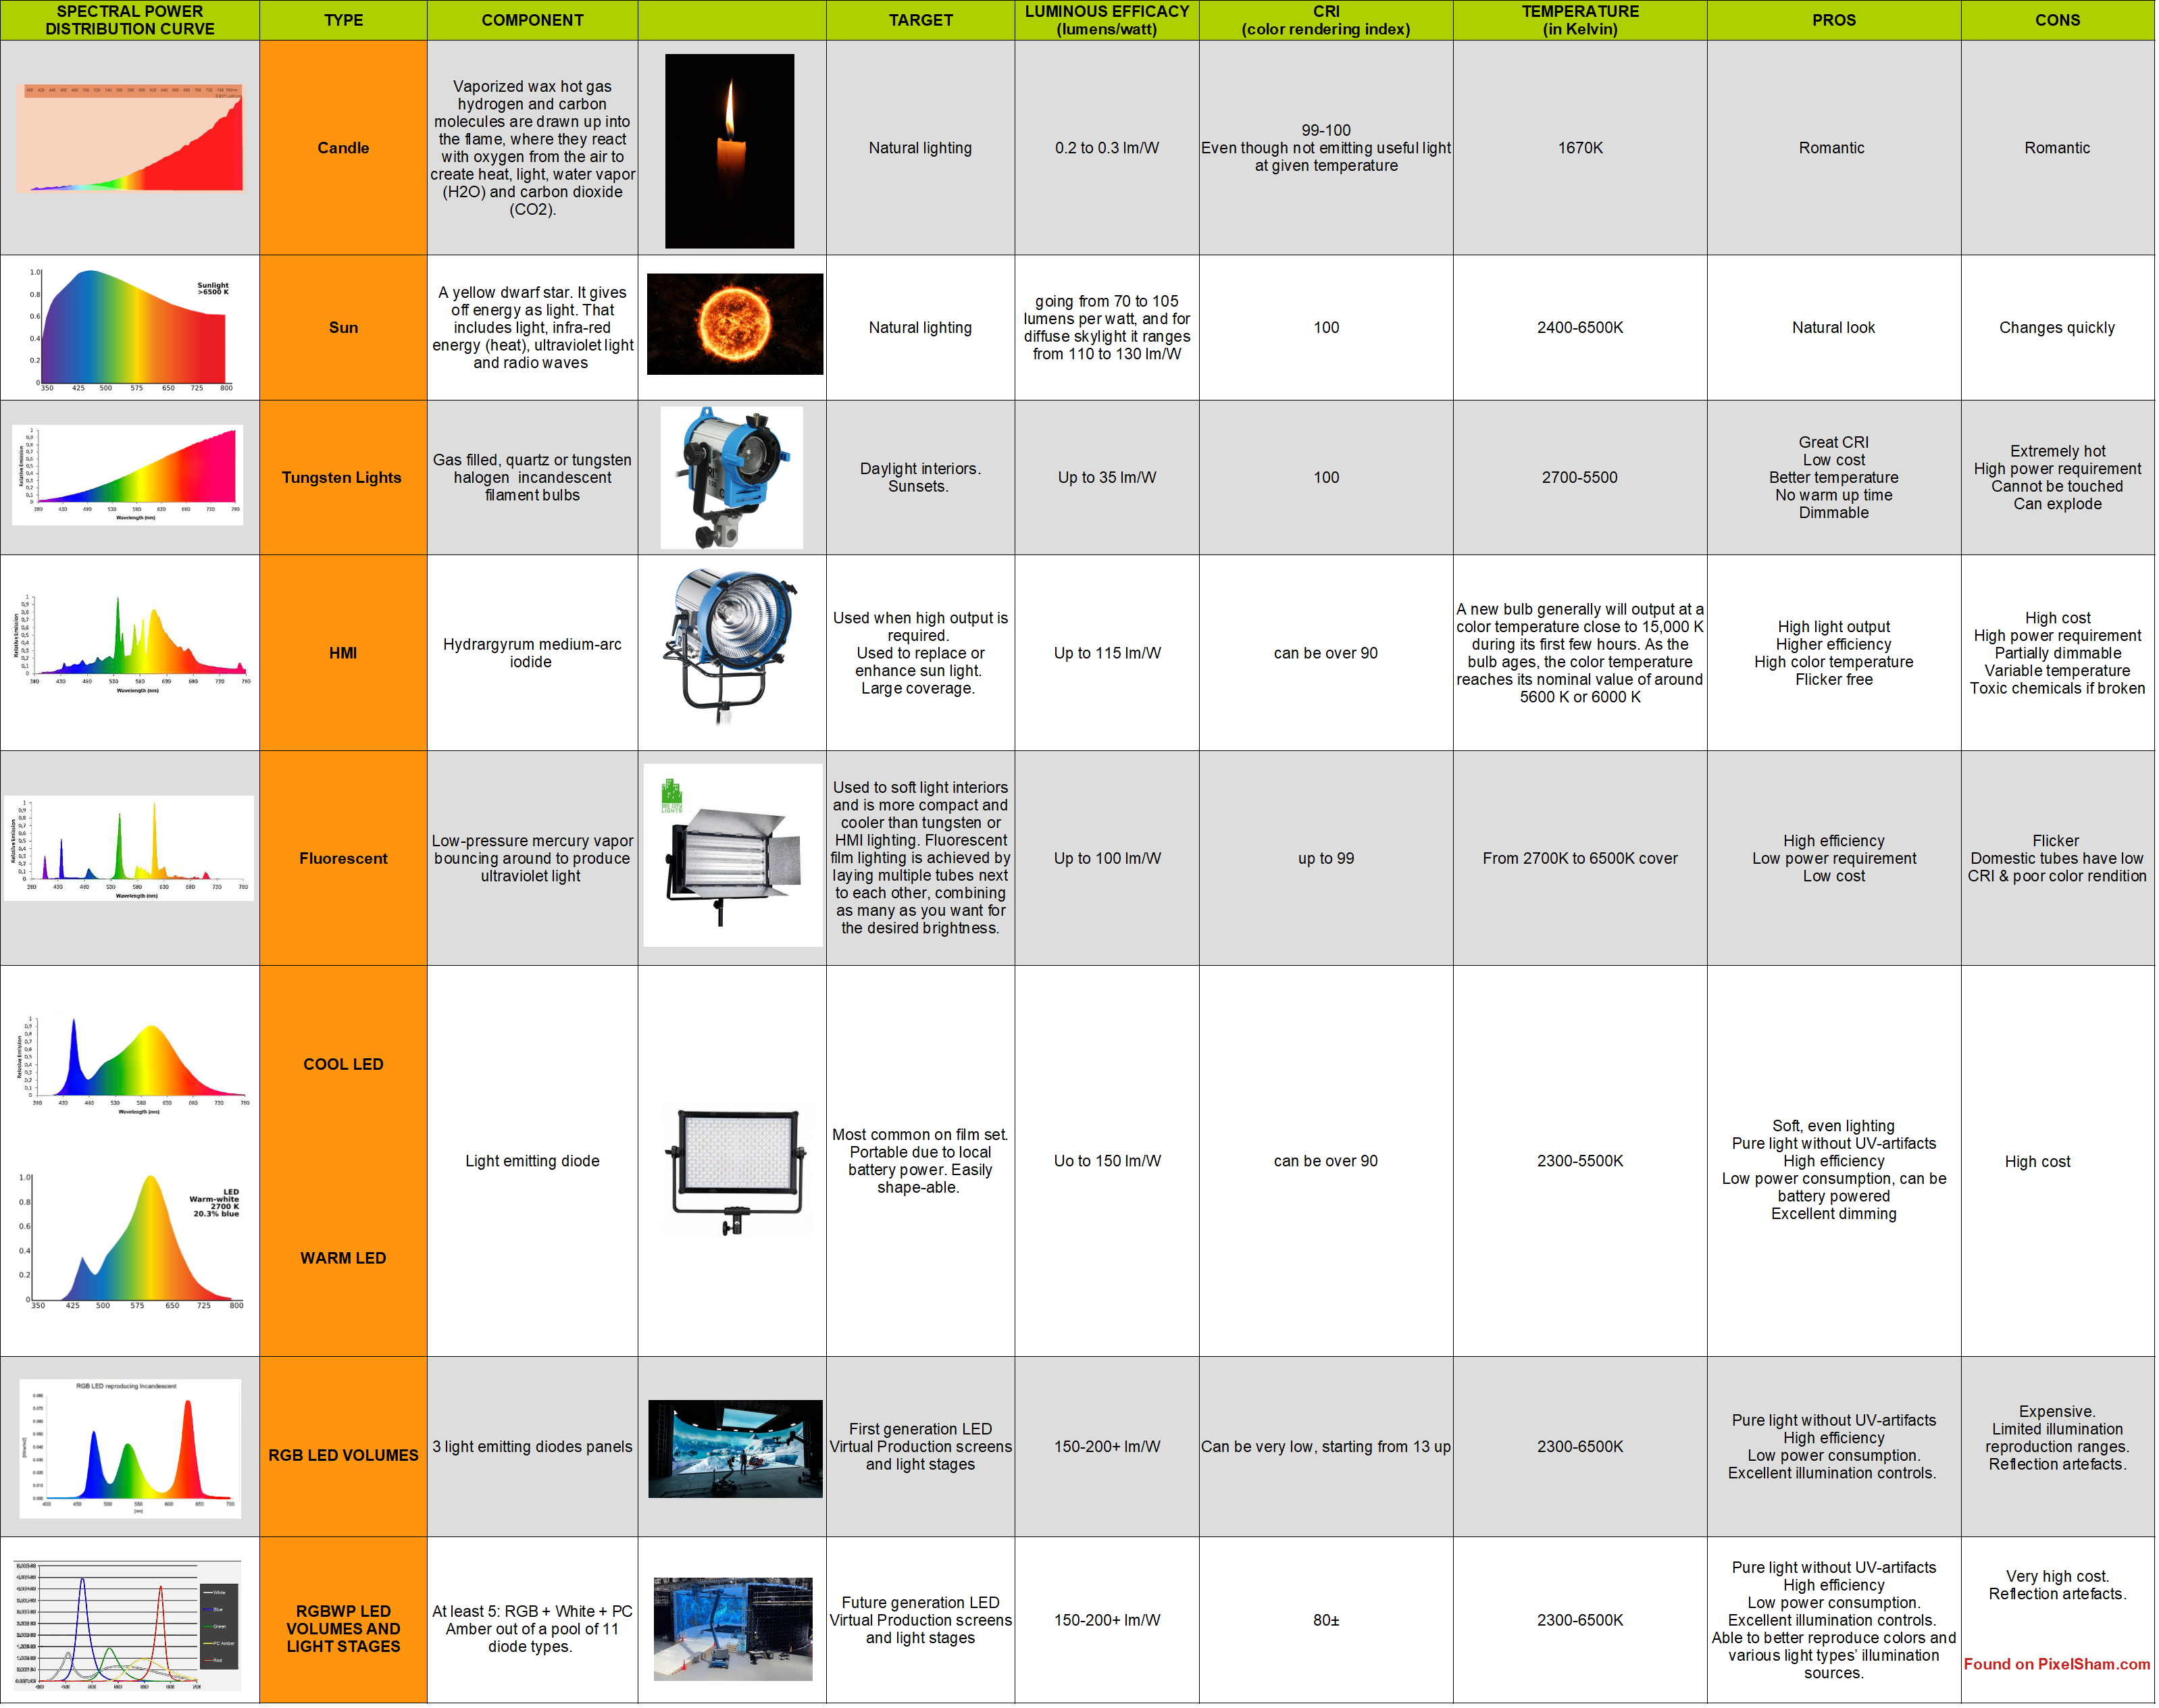
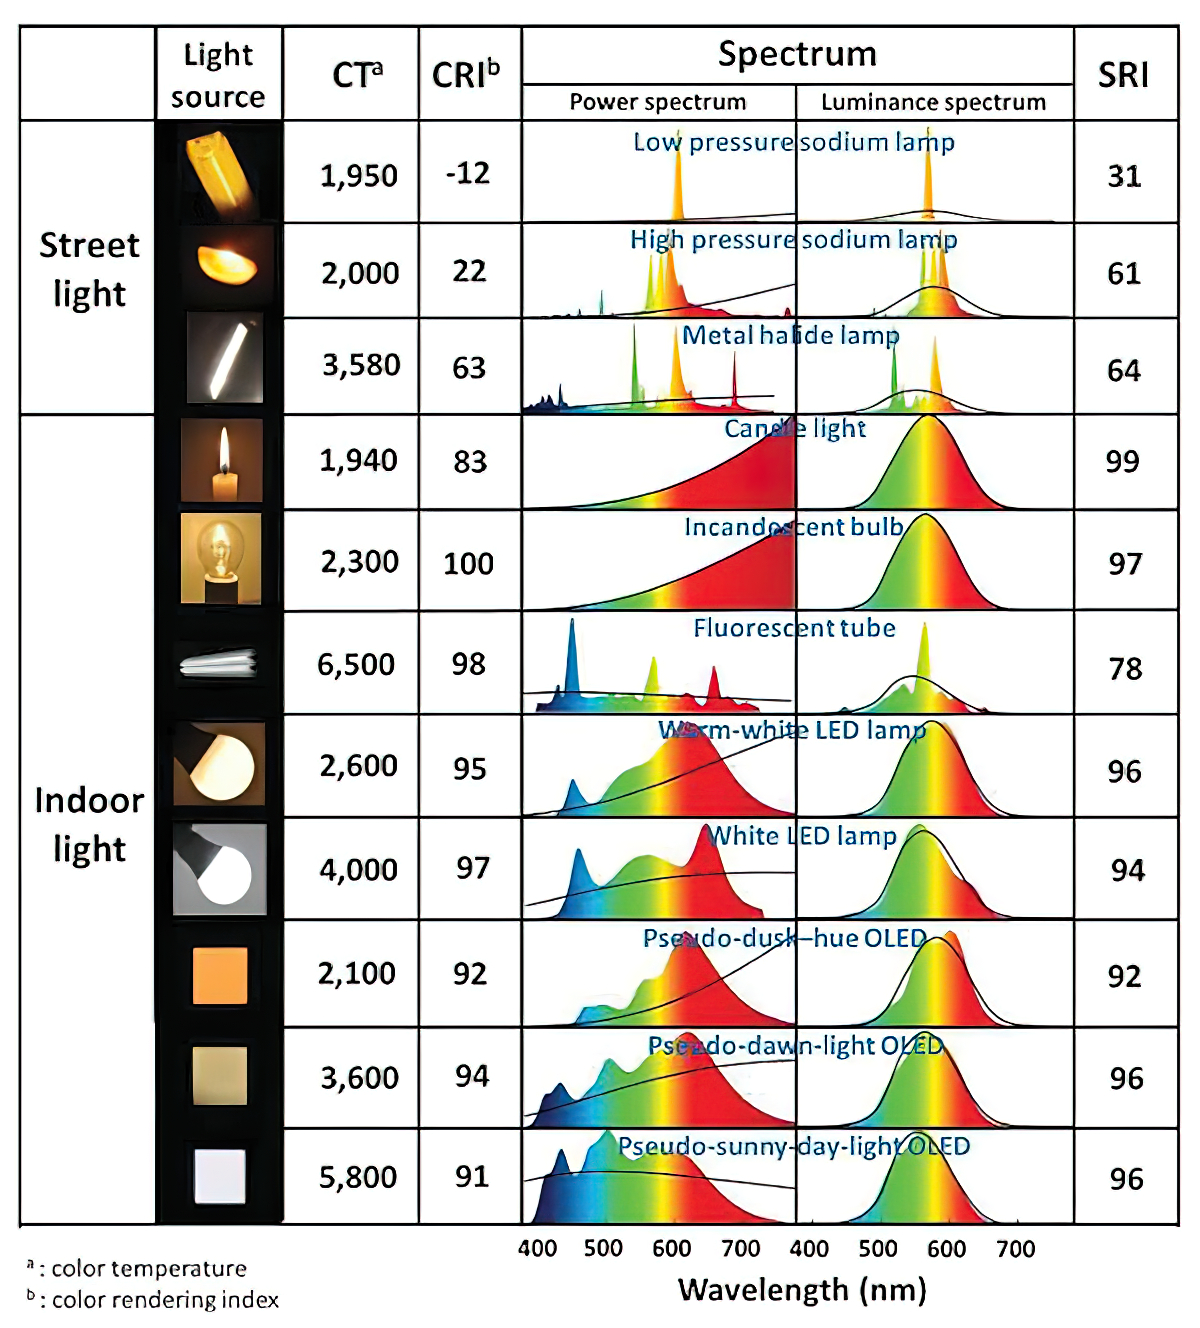
Use CRI, Luminous Efficacy and color temperature controls to match your needs.
Color Temperature
Color temperature describes the “color” of white light by a light source radiated by a perfect black body at a given temperature measured in degrees Kelvin
CRI
“The Color Rendering Index is a measurement of how faithfully a light source reveals the colors of whatever it illuminates, it describes the ability of a light source to reveal the color of an object, as compared to the color a natural light source would provide. The highest possible CRI is 100. A CRI of 100 generally refers to a perfect black body, like a tungsten light source or the sun. ”
Luminous Efficacy
Luminous efficacy is a measure of how well a light source produces visible light, watts out versus watts in, measured in lumens per watt. In other words it is a measurement that indicates the ability of a light source to emit visible light using a given amount of power. It is a ratio of the visible energy to the power that goes into the bulb.
Tungsten Lights
Light interiors and match domestic places or office locations. Daylight.
Advantages of Tungsten Lights
Almost perfect color rendition
Low cost
Does not use mercury like CFLs (fluorescent) or mercury vapor lights
Better color temperature than standard tungsten
Longer life than a conventional incandescent
Instant on to full brightness, no warm-up time, and it is dimmable
Disadvantages of Tungsten Lights
Extremely hot
High power requirement
The lamp is sensitive to oils and cannot be touched
The bulb is capable of blowing and sending hot glass shards outward. A screen or layer of glass on the outside of the lamp can protect users.
Hydrargyrum medium-arc iodide lights
HMI’s are used when high output is required. They are also used to recreate sun shining through windows or to fake additional sun while shooting exteriors. HMIs can light huge areas at once.
Advantages of HMI lights
High light output
Higher efficiency
High color temperature
Disadvantages of HMI lights:
High cost
High power requirement
Dims only to about 50%
the color temperature increases with dimming
HMI bulbs will explode is dropped and release toxic chemicals
Fluorescent
Fluorescent film lighting is achieved by laying multiple tubes next to each other, combining as many as you want for the desired brightness. The good news is you can choose your bulbs to either be warm or cool depending on the scenario you’re shooting. You want to get these bulbs close to the subject because they’re not great at opening up spaces. Fluorescent lighting is used to light interiors and is more compact and cooler than tungsten or HMI lighting.
Advantages of Fluorescent lights
High efficiency
Low power requirement
Low cost
Long lamp life
Cool
Capable of soft even lighting over a large area
Lightweight
Disadvantages of Fluorescent lights
Flicker
High CRI
Domestic tubes have low CRI & poor color rendition.
LED
LED’s are more and more common on film sets. You can use batteries to power them. That makes them portable and sleek – no messy cabled needed. You can rig your own panels of LED lights to fit any space necessary as well. LED’s can also power Fresnel style lamp heads such as the Arri L-series.
Advantages of LED light
Soft, even lighting
Pure light without UV-artifacts
High efficiency
Low power consumption, can be battery powered
Excellent dimming by means of pulse width modulation control
Long lifespan
Environmentally friendly
Insensitive to shock
No risk of explosion
Disadvantages of LED light
High cost.
LED’s are currently still expensive for their total light output
1 to 100% Stepless Dimming, 1500 Lux Brightness at 3.3′
LCD Info Screen. Powered by an L-series battery, D-Tap, or USB-C
Because the light has a variable color range of 3200 to 9500K, when the light is set to 5500K (daylight balanced) both sets of LEDs are on at full, providing the maximum brightness from this fixture when compared to using the light at 3200 or 9500K.
The LCD screen provides information on the fixture’s output as well as the charge state of the battery. The screen also indicates whether the adjustment knob is controlling brightness or color temperature. To switch from brightness to CCT or CCT to brightness, just apply a short press to the adjustment knob.
The included cold shoe ball joint adapter enables mounting the light to your camera’s accessory shoe via the 1/4″-20 threaded hole on the fixture. In addition, the bottom of the cold shoe foot features a 3/8″-16 threaded hole, and includes a 3/8″-16 to 1/4″-20 reducing bushing.
In photography, exposure value (EV) is a number that represents a combination of a camera’s shutter speed and f-number, such that all combinations that yield the same exposure have the same EV (for any fixed scene luminance).
The EV concept was developed in an attempt to simplify choosing among combinations of equivalent camera settings. Although all camera settings with the same EV nominally give the same exposure, they do not necessarily give the same picture. EV is also used to indicate an interval on the photographic exposure scale. 1 EV corresponding to a standard power-of-2 exposure step, commonly referred to as a stop
EV 0 corresponds to an exposure time of 1 sec and a relative aperture of f/1.0. If the EV is known, it can be used to select combinations of exposure time and f-number.
Note EV does not equal to photographic exposure. Photographic Exposureis defined as how much light hits the camera’s sensor. It depends on the camera settings mainly aperture and shutter speed. Exposure value (known as EV) is a number that represents theexposure setting of the camera.
Thus, strictly, EV is not a measure of luminance (indirect or reflected exposure) or illuminance (incidental exposure); rather, an EV corresponds to a luminance (or illuminance) for which a camera with a given ISO speed would use the indicated EV to obtain the nominally correct exposure. Nonetheless, it is common practice among photographic equipment manufacturers to express luminance in EV for ISO 100 speed, as when specifying metering range or autofocus sensitivity.
The exposure depends on two things: how much light gets through the lenses to the camera’s sensor and for how long the sensor is exposed. The former is a function of the aperture value while the latter is a function of the shutter speed. Exposure value is a number that represents this potential amount of light that could hit the sensor. It is important to understand that exposure value is a measure of how exposed the sensor is to light and not a measure of how much light actually hits the sensor. The exposure value is independent of how lit the scene is. For example a pair of aperture value and shutter speed represents the same exposure value both if the camera is used during a very bright day or during a dark night.
Each exposure value number represents all the possible shutter and aperture settings that result in the same exposure. Although the exposure value is the same for different combinations of aperture values and shutter speeds the resulting photo can be very different (the aperture controls the depth of field while shutter speed controls how much motion is captured).
EV 0.0 is defined as the exposure when setting the aperture to f-number 1.0 and the shutter speed to 1 second. All other exposure values are relative to that number. Exposure values are on a base two logarithmic scale. This means that every single step of EV – plus or minus 1 – represents the exposure (actual light that hits the sensor) being halved or doubled.
The exposure meter in the camera does not know whether the subject itself is bright or not. It simply measures the amount of light that comes in, and makes a guess based on that. The camera will aim for 18% gray, meaning if you take a photo of an entirely white surface, and an entirely black surface you should get two identical images which both are gray (at least in theory)
For reflected-light meters, camera settings are related to ISO speed and subject luminance by the reflected-light exposure equation:
where
N is the relative aperture (f-number)
t is the exposure time (“shutter speed”) in seconds
L is the average scene luminance
S is the ISO arithmetic speed
K is the reflected-light meter calibration constant
For incident-light meters, camera settings are related to ISO speed and subject illuminance by the incident-light exposure equation:
where
E is the illuminance (in lux)
C is the incident-light meter calibration constant
Two values for K are in common use: 12.5 (Canon, Nikon, and Sekonic) and 14 (Minolta, Kenko, and Pentax); the difference between the two values is approximately 1/6 EV.
For C a value of 250 is commonly used.
Nonetheless, it is common practice among photographic equipment manufacturers to also express luminance in EV for ISO 100 speed. Using K = 12.5, the relationship between EV at ISO 100 and luminance L is then :
L = 2(EV-3)
The situation with incident-light meters is more complicated than that for reflected-light meters, because the calibration constant C depends on the sensor type. Illuminance is measured with a flat sensor; a typical value for C is 250 with illuminance in lux. Using C = 250, the relationship between EV at ISO 100 and illuminance E is then :
Three basic factors go into the exposure formula itself instead: aperture, shutter, and ISO. Plus a light meter calibration constant.
f-stop²/shutter (in seconds) = lux * ISO/C
If you at least know four of those variables, you’ll be able to calculate the missing value.
So, say you want to figure out how much light you’re going to need in order to shoot at a certain f-stop. Well, all you do is plug in your values (you should know the f-stop, ISO, and your light meter calibration constant) into the formula below:
From that perspective, an exposure stop is a measurement of Exposure and provides a universal linear scale to measure the increase and decrease in light, exposed to the image sensor, due to changes in shutter speed, iso & f-stop.
+-1 stop is a doubling or halving of the amount of light let in when taking a photo.
1 EV is just another way to say one stop of exposure change.
One major use of EV (Exposure Value) is just to measure any change of exposure, where one EV implies a change of one stop of exposure. Like when we compensate our picture in the camera.
If the picture comes out too dark, our manual exposure could correct the next one by directly adjusting one of the three exposure controls (f/stop, shutter speed, or ISO). Or if using camera automation, the camera meter is controlling it, but we might apply +1 EV exposure compensation (or +1 EV flash compensation) to make the result goal brighter, as desired. This use of 1 EV is just another way to say one stop of exposure change.
On a perfect day the difference from sampling the sky vs the sun exposure with diffusing spot meters is about 3.2 exposure difference.
 ~15.4 EV for the sun
 ~12.2 EV for the sky
That is as a ballpark. All still influenced by surroundings, accuracy parameters, fov of the sensor…
Exposure value is basically used to indicate an interval on the photographic exposure scale, with a difference of 1 EV corresponding to a standard power-of-2 exposure step, also commonly referred to as a “stop”.
If you REALLY want to know the amount of light in absolute radiometric units, you’re going to need to use some kind of absolute light meter or measured light source to calibrate your camera. For references on how to do this, see: Section 2.5 Obtaining Absolute Radiance from http://www.pauldebevec.com/Research/HDR/debevec-siggraph97.pdf
IF you are still trying to gauge relative brightness, the level of the sun in Nuke can vary, but it should be in the thousands. Ie: between 30,000 and 65,0000 rgb value depending on time of the day, season and atmospherics.
The values for a 12 o’clock sun, with the sun sampled at EV 15.5 (shutter 1/30, ISO 100, F22) is 32.000 RGB max values (or 32,000 pixel luminance).
The thing to keep an eye for is the level of contrast between sunny side/fill side. The terminator should be quite obvious, there can be up to 3 stops difference between fill/key in sunny lit objects.
Note: In Foundry’s Nuke, the software will map 18% gray to whatever your center f/stop is set to in the viewer settings (f/8 by default… change that to EV by following the instructions below).
You can experiment with this by attaching an Exposure node to a Constant set to 0.18, setting your viewer read-out to Spotmeter, and adjusting the stops in the node up and down. You will see that a full stop up or down will give you the respective next value on the aperture scale (f8, f11, f16 etc.).
One stop doubles or halves the amount or light that hits the filmback/ccd, so everything works in powers of 2.
So starting with 0.18 in your constant, you will see that raising it by a stop will give you .36 as a floating point number (in linear space), while your f/stop will be f/11 and so on.
If you set your center stop to 0 (see below) you will get a relative readout in EVs, where EV 0 again equals 18% constant gray.
Note: make sure to set your Nuke read node to ‘raw data’
In other words. Setting the center f-stop to 0 means that in a neutral plate, the middle gray in the macbeth chart will equal to exposure value 0. EV 0 corresponds to an exposure time of 1 sec and an aperture of f/1.0.
To switch Foundry’s Nuke’s SpotMeter to return the EV of an image, click on the main viewport, and then press s, this opens the viewer’s properties. Now set the center f-stop to 0 in there. And the SpotMeter in the viewport will change from aperture and fstops to EV.
If you are trying to gauge the EV from the pixel luminance in the image:
– Setting the center f-stop to 0 means that in a neutral plate, the middle 18% gray will equal to exposure value 0.
– So if EV 0 = 0.18 middle gray in nuke which equal to a pixel luminance of 0.18, doubling that value, doubles the EV.
Exposure Fusion is a method for combining images taken with different exposure settings into one image that looks like a tone mapped High Dynamic Range (HDR) image.
DISCLAIMER – Links and images on this website may be protected by the respective owners’ copyright. All data submitted by users through this site shall be treated as freely available to share.


