


Views : 45


3Dprinting (178) A.I. (846) animation (350) blender (210) colour (233) commercials (52) composition (153) cool (364) design (649) Featured (80) hardware (314) IOS (109) jokes (139) lighting (289) modeling (145) music (186) photogrammetry (192) photography (755) production (1291) python (94) quotes (497) reference (314) software (1356) trailers (307) ves (555) VR (221)
Also see: https://www.pixelsham.com/2015/05/16/how-aperture-shutter-speed-and-iso-affect-your-photos/
In photography, exposure value (EV) is a number that represents a combination of a camera’s shutter speed and f-number, such that all combinations that yield the same exposure have the same EV (for any fixed scene luminance).

The EV concept was developed in an attempt to simplify choosing among combinations of equivalent camera settings. Although all camera settings with the same EV nominally give the same exposure, they do not necessarily give the same picture. EV is also used to indicate an interval on the photographic exposure scale. 1 EV corresponding to a standard power-of-2 exposure step, commonly referred to as a stop
EV 0 corresponds to an exposure time of 1 sec and a relative aperture of f/1.0. If the EV is known, it can be used to select combinations of exposure time and f-number.
Note EV does not equal to photographic exposure. Photographic Exposure is defined as how much light hits the camera’s sensor. It depends on the camera settings mainly aperture and shutter speed. Exposure value (known as EV) is a number that represents the exposure setting of the camera.
Thus, strictly, EV is not a measure of luminance (indirect or reflected exposure) or illuminance (incidental exposure); rather, an EV corresponds to a luminance (or illuminance) for which a camera with a given ISO speed would use the indicated EV to obtain the nominally correct exposure. Nonetheless, it is common practice among photographic equipment manufacturers to express luminance in EV for ISO 100 speed, as when specifying metering range or autofocus sensitivity.
The exposure depends on two things: how much light gets through the lenses to the camera’s sensor and for how long the sensor is exposed. The former is a function of the aperture value while the latter is a function of the shutter speed. Exposure value is a number that represents this potential amount of light that could hit the sensor. It is important to understand that exposure value is a measure of how exposed the sensor is to light and not a measure of how much light actually hits the sensor. The exposure value is independent of how lit the scene is. For example a pair of aperture value and shutter speed represents the same exposure value both if the camera is used during a very bright day or during a dark night.
Each exposure value number represents all the possible shutter and aperture settings that result in the same exposure. Although the exposure value is the same for different combinations of aperture values and shutter speeds the resulting photo can be very different (the aperture controls the depth of field while shutter speed controls how much motion is captured).
EV 0.0 is defined as the exposure when setting the aperture to f-number 1.0 and the shutter speed to 1 second. All other exposure values are relative to that number. Exposure values are on a base two logarithmic scale. This means that every single step of EV – plus or minus 1 – represents the exposure (actual light that hits the sensor) being halved or doubled.
https://www.streetdirectory.com/travel_guide/141307/photography/exposure_value_ev_and_exposure_compensation.html
https://en.wikipedia.org/wiki/Exposure_value
https://www.scantips.com/lights/math.html
![]()
which means 2EV = N² / t
where
EV 0 corresponds to an exposure time of 1 sec and an aperture of f/1.0.
Example: If f/16 and 1/4 second, then this is:
(N² / t) = (16 × 16 ÷ 1/4) = (16 × 16 × 4) = 1024.
Log₂(1024) is EV 10. Meaning, 210 = 1024.
The exposure meter in the camera does not know whether the subject itself is bright or not. It simply measures the amount of light that comes in, and makes a guess based on that. The camera will aim for 18% gray, meaning if you take a photo of an entirely white surface, and an entirely black surface you should get two identical images which both are gray (at least in theory)
https://en.wikipedia.org/wiki/Light_meter
For reflected-light meters, camera settings are related to ISO speed and subject luminance by the reflected-light exposure equation:
![]()
where
For incident-light meters, camera settings are related to ISO speed and subject illuminance by the incident-light exposure equation:

where
Two values for K are in common use: 12.5 (Canon, Nikon, and Sekonic) and 14 (Minolta, Kenko, and Pentax); the difference between the two values is approximately 1/6 EV.
For C a value of 250 is commonly used.
Nonetheless, it is common practice among photographic equipment manufacturers to also express luminance in EV for ISO 100 speed. Using K = 12.5, the relationship between EV at ISO 100 and luminance L is then :
L = 2(EV-3)
The situation with incident-light meters is more complicated than that for reflected-light meters, because the calibration constant C depends on the sensor type. Illuminance is measured with a flat sensor; a typical value for C is 250 with illuminance in lux. Using C = 250, the relationship between EV at ISO 100 and illuminance E is then :
E = 2.5 * 2(EV)
https://nofilmschool.com/2018/03/want-easier-and-faster-way-calculate-exposure-formula
Three basic factors go into the exposure formula itself instead: aperture, shutter, and ISO. Plus a light meter calibration constant.
f-stop²/shutter (in seconds) = lux * ISO/C
If you at least know four of those variables, you’ll be able to calculate the missing value.
So, say you want to figure out how much light you’re going to need in order to shoot at a certain f-stop. Well, all you do is plug in your values (you should know the f-stop, ISO, and your light meter calibration constant) into the formula below:
lux = C (f-stop²/shutter (in seconds))/ISO
Exposure Value Calculator:
https://snapheadshots.com/resources/exposure-and-light-calculator
https://www.scantips.com/lights/exposurecalc.html
https://www.pointsinfocus.com/tools/exposure-settings-ev-calculator/#google_vignette
From that perspective, an exposure stop is a measurement of Exposure and provides a universal linear scale to measure the increase and decrease in light, exposed to the image sensor, due to changes in shutter speed, iso & f-stop.
+-1 stop is a doubling or halving of the amount of light let in when taking a photo.
1 EV is just another way to say one stop of exposure change.
One major use of EV (Exposure Value) is just to measure any change of exposure, where one EV implies a change of one stop of exposure. Like when we compensate our picture in the camera.
If the picture comes out too dark, our manual exposure could correct the next one by directly adjusting one of the three exposure controls (f/stop, shutter speed, or ISO). Or if using camera automation, the camera meter is controlling it, but we might apply +1 EV exposure compensation (or +1 EV flash compensation) to make the result goal brighter, as desired. This use of 1 EV is just another way to say one stop of exposure change.
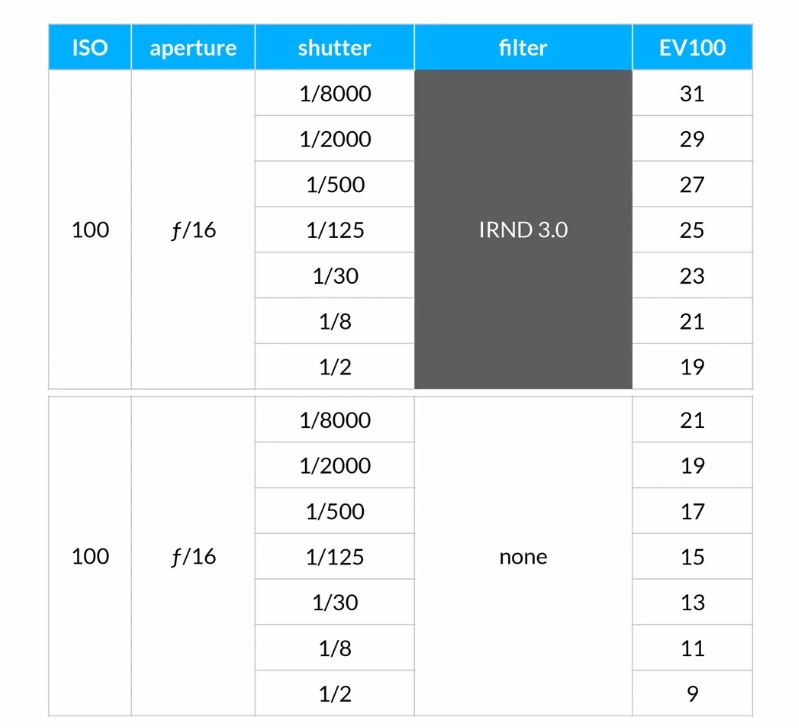
On a perfect day the difference from sampling the sky vs the sun exposure with diffusing spot meters is about 3.2 exposure difference.
 ~15.4 EV for the sun
 ~12.2 EV for the sky
That is as a ballpark. All still influenced by surroundings, accuracy parameters, fov of the sensor…


EV calculator
https://www.scantips.com/lights/evchart.html#calc
http://www.fredparker.com/ultexp1.htm
Exposure value is basically used to indicate an interval on the photographic exposure scale, with a difference of 1 EV corresponding to a standard power-of-2 exposure step, also commonly referred to as a “stop”.
https://contrastly.com/a-guide-to-understanding-exposure-value-ev/
All you can hope to measure with your camera and some images is the relative reflected luminance. Even if you have the camera settings. https://en.wikipedia.org/wiki/Relative_luminance
If you REALLY want to know the amount of light in absolute radiometric units, you’re going to need to use some kind of absolute light meter or measured light source to calibrate your camera. For references on how to do this, see: Section 2.5 Obtaining Absolute Radiance from http://www.pauldebevec.com/Research/HDR/debevec-siggraph97.pdf
IF you are still trying to gauge relative brightness, the level of the sun in Nuke can vary, but it should be in the thousands. Ie: between 30,000 and 65,0000 rgb value depending on time of the day, season and atmospherics.
The values for a 12 o’clock sun, with the sun sampled at EV 15.5 (shutter 1/30, ISO 100, F22) is 32.000 RGB max values (or 32,000 pixel luminance).
The thing to keep an eye for is the level of contrast between sunny side/fill side. The terminator should be quite obvious, there can be up to 3 stops difference between fill/key in sunny lit objects.
Note: In Foundry’s Nuke, the software will map 18% gray to whatever your center f/stop is set to in the viewer settings (f/8 by default… change that to EV by following the instructions below).
You can experiment with this by attaching an Exposure node to a Constant set to 0.18, setting your viewer read-out to Spotmeter, and adjusting the stops in the node up and down. You will see that a full stop up or down will give you the respective next value on the aperture scale (f8, f11, f16 etc.).
One stop doubles or halves the amount or light that hits the filmback/ccd, so everything works in powers of 2.
So starting with 0.18 in your constant, you will see that raising it by a stop will give you .36 as a floating point number (in linear space), while your f/stop will be f/11 and so on.
If you set your center stop to 0 (see below) you will get a relative readout in EVs, where EV 0 again equals 18% constant gray.
Note: make sure to set your Nuke read node to ‘raw data’

In other words. Setting the center f-stop to 0 means that in a neutral plate, the middle gray in the macbeth chart will equal to exposure value 0. EV 0 corresponds to an exposure time of 1 sec and an aperture of f/1.0.
To switch Foundry’s Nuke’s SpotMeter to return the EV of an image, click on the main viewport, and then press s, this opens the viewer’s properties. Now set the center f-stop to 0 in there. And the SpotMeter in the viewport will change from aperture and fstops to EV.
If you are trying to gauge the EV from the pixel luminance in the image:
– Setting the center f-stop to 0 means that in a neutral plate, the middle 18% gray will equal to exposure value 0.
– So if EV 0 = 0.18 middle gray in nuke which equal to a pixel luminance of 0.18, doubling that value, doubles the EV.
.18 pixel luminance = 0EV
.36 pixel luminance = 1EV
.72 pixel luminance = 2EV
1.46 pixel luminance = 3EV
...
This is a Geometric Progression function: xn = ar(n-1)
The most basic example of this function is 1,2,4,8,16,32,… The sequence starts at 1 and doubles each time, so
And we get:
{a, ar, ar2, ar3, … }
= {1, 1×2, 1×22, 1×23, … }
= {1, 2, 4, 8, … }
In this example the function translates to: n = 2(n-1)
You can graph this curve through this expression: x = 2(y-1) :

You can go back and forth between the two values through a geometric progression function and a log function:
(Note: in a spreadsheet this is: = POWER(2; cell# -1) and =LOG(cell#, 2)+1) )
| 2(y-1) | log2(x)+1 |
| x | y |
| 1 | 1 |
| 2 | 2 |
| 4 | 3 |
| 8 | 4 |
| 16 | 5 |
| 32 | 6 |
| 64 | 7 |
| 128 | 8 |
| 256 | 9 |
| 512 | 10 |
| 1024 | 11 |
| 2048 | 12 |
| 4096 | 13 |
Translating this into a geometric progression between an image pixel luminance and EV:
import math,sys

def Exposure2Intensity(exposure):
    exp = float(exposure)
    result = math.pow(2,exp)
    print(result)

Exposure2Intensity(0)

def Intensity2Exposure(intensity):
    inarg = float(intensity)

    if inarg == 0:
        print("Exposure of zero intensity is undefined.")
        return

    if inarg < 1e-323:
        inarg = max(inarg, 1e-323)
        print("Exposure of negative intensities is undefined. Clamping to a very small value instead (1e-323)")

    result = math.log(inarg, 2)
    print(result)

Intensity2Exposure(0.1)
Also see:
https://www.pixelsham.com/2018/11/22/exposure-value-measurements/
https://www.pixelsham.com/2016/03/03/f-stop-vs-t-stop/

An exposure stop is a unit measurement of Exposure as such it provides a universal linear scale to measure the increase and decrease in light, exposed to the image sensor, due to changes in shutter speed, iso and f-stop.
+-1 stop is a doubling or halving of the amount of light let in when taking a photo
1 EV (exposure value) is just another way to say one stop of exposure change.
https://www.photographymad.com/pages/view/what-is-a-stop-of-exposure-in-photography
Same applies to shutter speed, iso and aperture.
Doubling or halving your shutter speed produces an increase or decrease of 1 stop of exposure.
Doubling or halving your iso speed produces an increase or decrease of 1 stop of exposure.


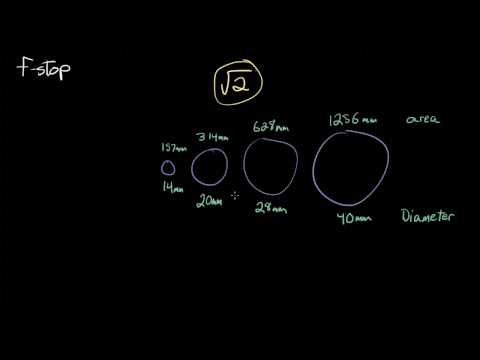
Because of the way f-stop numbers are calculated (ratio of focal length/lens diameter, where focal length is the distance between the lens and the sensor), an f-stop doesn’t relate to a doubling or halving of the value, but to the doubling/halving of the area coverage of a lens in relation to its focal length. And as such, to a multiplying or dividing by 1.41 (the square root of 2). For example, going from f/2.8 to f/4 is a decrease of 1 stop because 4 = 2.8 * 1.41. Changing from f/16 to f/11 is an increase of 1 stop because 11 = 16 / 1.41.

A wider aperture means that light proceeding from the foreground, subject, and background is entering at more oblique angles than the light entering less obliquely.
Consider that absolutely everything is bathed in light, therefore light bouncing off of anything is effectively omnidirectional. Your camera happens to be picking up a tiny portion of the light that’s bouncing off into infinity.
Now consider that the wider your iris/aperture, the more of that omnidirectional light you’re picking up:

When you have a very narrow iris you are eliminating a lot of oblique light. Whatever light enters, from whatever distance, enters moderately parallel as a whole. When you have a wide aperture, much more light is entering at a multitude of angles. Your lens can only focus the light from one depth – the foreground/background appear blurred because it cannot be focused on.
https://frankwhitephotography.com/index.php?id=28:what-is-a-stop-in-photography

The great thing about stops is that they give us a way to directly compare shutter speed, aperture diameter, and ISO speed. This means that we can easily swap these three components about while keeping the overall exposure the same.
http://lifehacker.com/how-aperture-shutter-speed-and-iso-affect-pictures-sh-1699204484

https://www.techradar.com/how-to/the-exposure-triangle

https://www.videoschoolonline.com/what-is-an-exposure-stop
Note. All three of these measurements (aperture, shutter, iso) have full stops, half stops and third stops, but if you look at the numbers they aren’t always consistent. For example, a one third stop between ISO100 and ISO 200 would be ISO133, yet most cameras are marked at ISO125.

Third-stops are especially important as they’re the increment that most cameras use for their settings. These are just imaginary divisions in each stop.
From a practical standpoint manufacturers only standardize the full stops, meaning that while they try and stay somewhat consistent there is some rounding up going on between the smaller numbers.


Note that ND Filters directly modify the exposure triangle.


https://draftdocs.acescentral.com/background/whats-new/
ACES 2.0 is the second major release of the components that make up the ACES system. The most significant change is a new suite of rendering transforms whose design was informed by collected feedback and requests from users of ACES 1. The changes aim to improve the appearance of perceived artifacts and to complete previously unfinished components of the system, resulting in a more complete, robust, and consistent product.
Highlights of the key changes in ACES 2.0 are as follows:
The most substantial change in ACES 2.0 is a complete redesign of the rendering transform.
ACES 2.0 was built as a unified system, rather than through piecemeal additions. Different deliverable outputs “match” better and making outputs to display setups other than the provided presets is intended to be user-driven. The rendering transforms are less likely to produce undesirable artifacts “out of the box”, which means less time can be spent fixing problematic images and more time making pictures look the way you want.
https://www.linkedin.com/pulse/hidden-risks-using-chatgpt-anonymous-ai-tools-workflows-wilson-govcc
If you’re serious about protecting your IP, client relationships, and professional credibility, you need to stop treating generative AI tools like consumer-grade apps. This isn’t about fear, it’s about operational discipline. Below are immediate steps you can take to reduce your exposure and stay in control of your creative pipeline.

https://www.nature.com/articles/d41586-024-01518-2
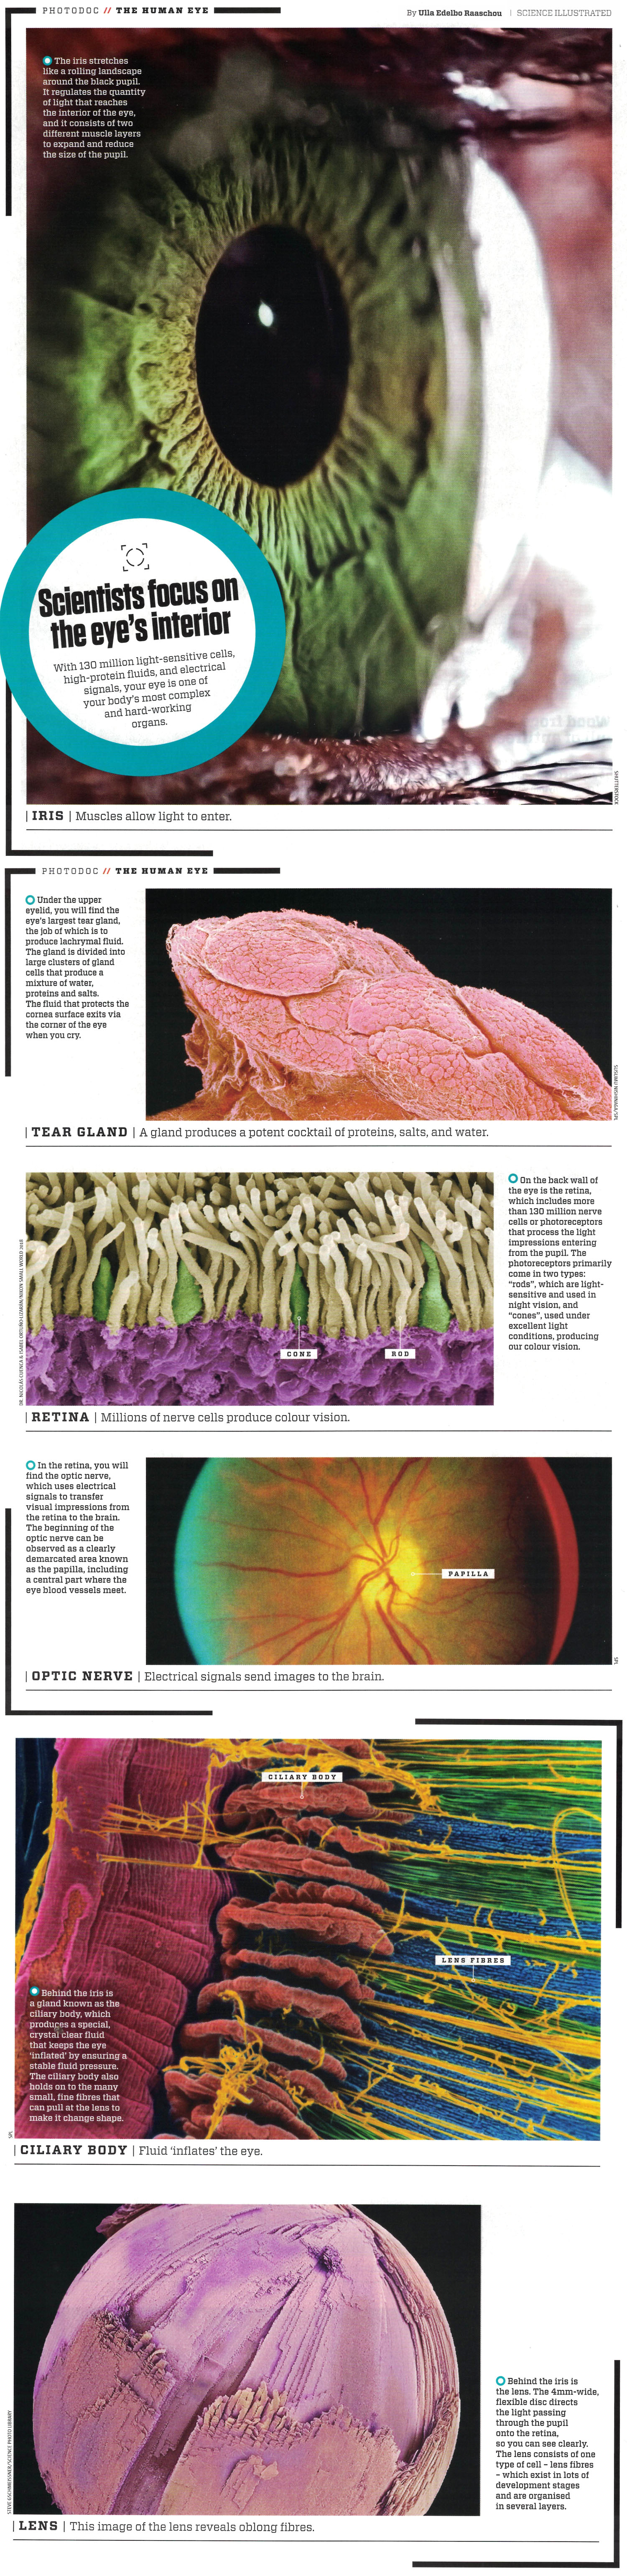
The prevalence of myopia is increasing rapidly, with projections indicating that by 2050, around half of the global population could be affected. This surge is largely attributed to lifestyle changes, such as increased time spent indoors and on screens, and decreased outdoor activities, starting with the Covid lock down.
To combat this epidemic, researchers are advocating for more outdoor exposure for children, as natural light is beneficial in slowing the progression of myopia. They also emphasize the importance of regular eye check-ups and early interventions. Additionally, innovative treatments such as specially designed contact lenses and low-dose atropine eye drops are being explored to manage and reduce the progression of myopia.
https://diffusionlight.github.io/
https://github.com/DiffusionLight/DiffusionLight
https://github.com/DiffusionLight/DiffusionLight?tab=MIT-1-ov-file#readme
https://colab.research.google.com/drive/15pC4qb9mEtRYsW3utXkk-jnaeVxUy-0S
“a simple yet effective technique to estimate lighting in a single input image. Current techniques rely heavily on HDR panorama datasets to train neural networks to regress an input with limited field-of-view to a full environment map. However, these approaches often struggle with real-world, uncontrolled settings due to the limited diversity and size of their datasets. To address this problem, we leverage diffusion models trained on billions of standard images to render a chrome ball into the input image. Despite its simplicity, this task remains challenging: the diffusion models often insert incorrect or inconsistent objects and cannot readily generate images in HDR format. Our research uncovers a surprising relationship between the appearance of chrome balls and the initial diffusion noise map, which we utilize to consistently generate high-quality chrome balls. We further fine-tune an LDR difusion model (Stable Diffusion XL) with LoRA, enabling it to perform exposure bracketing for HDR light estimation. Our method produces convincing light estimates across diverse settings and demonstrates superior generalization to in-the-wild scenarios.”

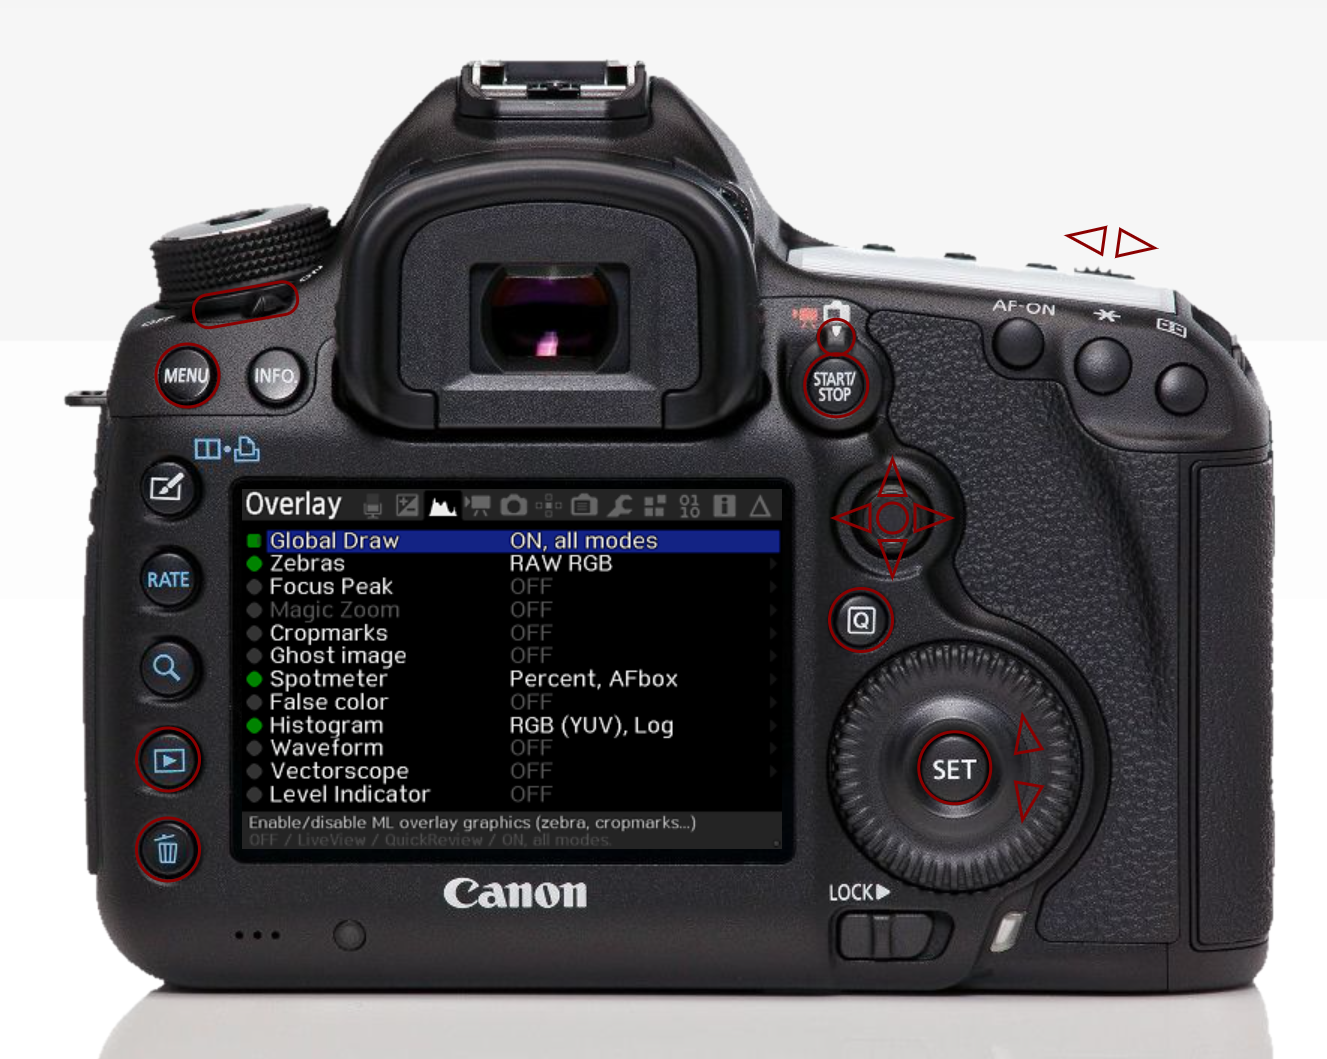
https://builds.magiclantern.fm/
Supported cameras:
5D Mark II, 5D Mark III, 6D, 7D, 50D, 60D, 500D/T1i, 550D/T2i, 600D/T3i, 650D/T4i, 700D/T5i, 1100D/T3, EOS M.
Example features:
Divesh Naidoo: The video below was made with a live in-camera preview and auto-exposure matching, no camera solve, no HDRI capture and no manual compositing setup. Using the new Simulon phone app.
LDR to HDR through ML
https://simulon.typeform.com/betatest
Process example
The human eye perceives half scene brightness not as the linear 50% of the present energy (linear nature values) but as 18% of the overall brightness. We are biased to perceive more information in the dark and contrast areas. A Macbeth chart helps with calibrating back into a photographic capture into this “human perspective” of the world.
https://en.wikipedia.org/wiki/Middle_gray
In photography, painting, and other visual arts, middle gray or middle grey is a tone that is perceptually about halfway between black and white on a lightness scale in photography and printing, it is typically defined as 18% reflectance in visible light
Light meters, cameras, and pictures are often calibrated using an 18% gray card[4][5][6] or a color reference card such as a ColorChecker. On the assumption that 18% is similar to the average reflectance of a scene, a grey card can be used to estimate the required exposure of the film.
https://en.wikipedia.org/wiki/ColorChecker

The exposure meter in the camera does not know whether the subject itself is bright or not. It simply measures the amount of light that comes in, and makes a guess based on that. The camera will aim for 18% gray independently, meaning if you take a photo of an entirely white surface, and an entirely black surface you should get two identical images which both are gray (at least in theory). Thus enters the Macbeth chart.

<!–more–>
Note that Chroma Key Green is reasonably close to an 18% gray reflectance.
http://www.rags-int-inc.com/PhotoTechStuff/MacbethTarget/


https://upload.wikimedia.org/wikipedia/commons/b/b4/CIE1931xy_ColorChecker_SMIL.svg

RGB coordinates of the Macbeth ColorChecker
https://pdfs.semanticscholar.org/0e03/251ad1e6d3c3fb9cb0b1f9754351a959e065.pdf


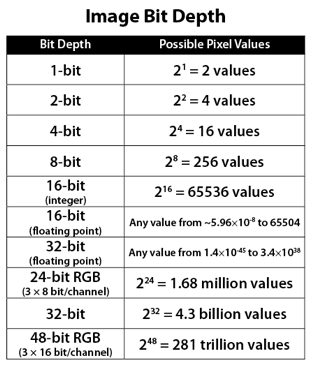
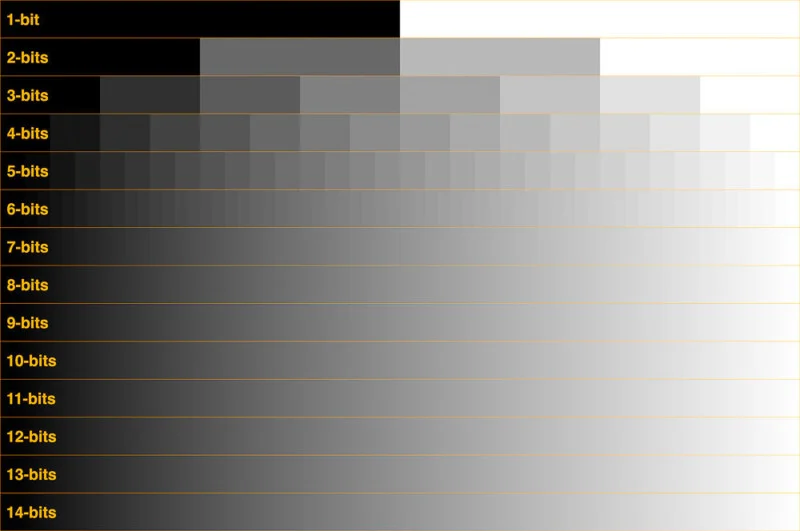
The terms 8-bit, 16-bit, 16-bit float, and 32-bit refer to different data formats used to store and represent image information, as bits per pixel.
https://en.wikipedia.org/wiki/Color_depth
In color technology, color depth also known as bit depth, is either the number of bits used to indicate the color of a single pixel, OR the number of bits used for each color component of a single pixel.
When referring to a pixel, the concept can be defined as bits per pixel (bpp).
When referring to a color component, the concept can be defined as bits per component, bits per channel, bits per color (all three abbreviated bpc), and also bits per pixel component, bits per color channel or bits per sample (bps). Modern standards tend to use bits per component, but historical lower-depth systems used bits per pixel more often.
Color depth is only one aspect of color representation, expressing the precision with which the amount of each primary can be expressed; the other aspect is how broad a range of colors can be expressed (the gamut). The definition of both color precision and gamut is accomplished with a color encoding specification which assigns a digital code value to a location in a color space.

Here’s a simple explanation of each.
8-bit images (i.e. 24 bits per pixel for a color image) are considered Low Dynamic Range.
They can store around 5 stops of light and each pixel carry a value from 0 (black) to 255 (white).
As a comparison, DSLR cameras can capture ~12-15 stops of light and they use RAW files to store the information.
16-bit: This format is commonly referred to as “half-precision.” It uses 16 bits of data to represent color values for each pixel. With 16 bits, you can have 65,536 discrete levels of color, allowing for relatively high precision and smooth gradients. However, it has a limited dynamic range, meaning it cannot accurately represent extremely bright or dark values. It is commonly used for regular images and textures.
16-bit float: This format is an extension of the 16-bit format but uses floating-point numbers instead of fixed integers. Floating-point numbers allow for more precise calculations and a larger dynamic range. In this case, the 16 bits are used to store both the color value and the exponent, which controls the range of values that can be represented. The 16-bit float format provides better accuracy and a wider dynamic range than regular 16-bit, making it useful for high-dynamic-range imaging (HDRI) and computations that require more precision.
32-bit: (i.e. 96 bits per pixel for a color image) are considered High Dynamic Range. This format, also known as “full-precision” or “float,” uses 32 bits to represent color values and offers the highest precision and dynamic range among the three options. With 32 bits, you have a significantly larger number of discrete levels, allowing for extremely accurate color representation, smooth gradients, and a wide range of brightness values. It is commonly used for professional rendering, visual effects, and scientific applications where maximum precision is required.
Bits and HDR coverage
High Dynamic Range (HDR) images are designed to capture a wide range of luminance values, from the darkest shadows to the brightest highlights, in order to reproduce a scene with more accuracy and detail. The bit depth of an image refers to the number of bits used to represent each pixel’s color information. When comparing 32-bit float and 16-bit float HDR images, the drop in accuracy primarily relates to the precision of the color information.
A 32-bit float HDR image offers a higher level of precision compared to a 16-bit float HDR image. In a 32-bit float format, each color channel (red, green, and blue) is represented by 32 bits, allowing for a larger range of values to be stored. This increased precision enables the image to retain more details and subtleties in color and luminance.
On the other hand, a 16-bit float HDR image utilizes 16 bits per color channel, resulting in a reduced range of values that can be represented. This lower precision leads to a loss of fine details and color nuances, especially in highly contrasted areas of the image where there are significant differences in luminance.
The drop in accuracy between 32-bit and 16-bit float HDR images becomes more noticeable as the exposure range of the scene increases. Exposure range refers to the span between the darkest and brightest areas of an image. In scenes with a limited exposure range, where the luminance differences are relatively small, the loss of accuracy may not be as prominent or perceptible. These images usually are around 8-10 exposure levels.
However, in scenes with a wide exposure range, such as a landscape with deep shadows and bright highlights, the reduced precision of a 16-bit float HDR image can result in visible artifacts like color banding, posterization, and loss of detail in both shadows and highlights. The image may exhibit abrupt transitions between tones or colors, which can appear unnatural and less realistic.
To provide a rough estimate, it is often observed that exposure values beyond approximately ±6 to ±8 stops from the middle gray (18% reflectance) may be more prone to accuracy issues in a 16-bit float format. This range may vary depending on the specific implementation and encoding scheme used.
To summarize, the drop in accuracy between 32-bit and 16-bit float HDR images is mainly related to the reduced precision of color information. This decrease in precision becomes more apparent in scenes with a wide exposure range, affecting the representation of fine details and leading to visible artifacts in the image.
In practice, this means that exposure values beyond a certain range will experience a loss of accuracy and detail when stored in a 16-bit float format. The exact range at which this loss occurs depends on the encoding scheme and the specific implementation. However, in general, extremely bright or extremely dark values that fall outside the representable range may be subject to quantization errors, resulting in loss of detail, banding, or other artifacts.
HDRs used for lighting purposes are usually slightly convolved to improve on sampling speed and removing specular artefacts. To that extent, 16 bit float HDRIs tend to me most used in CG cycles.
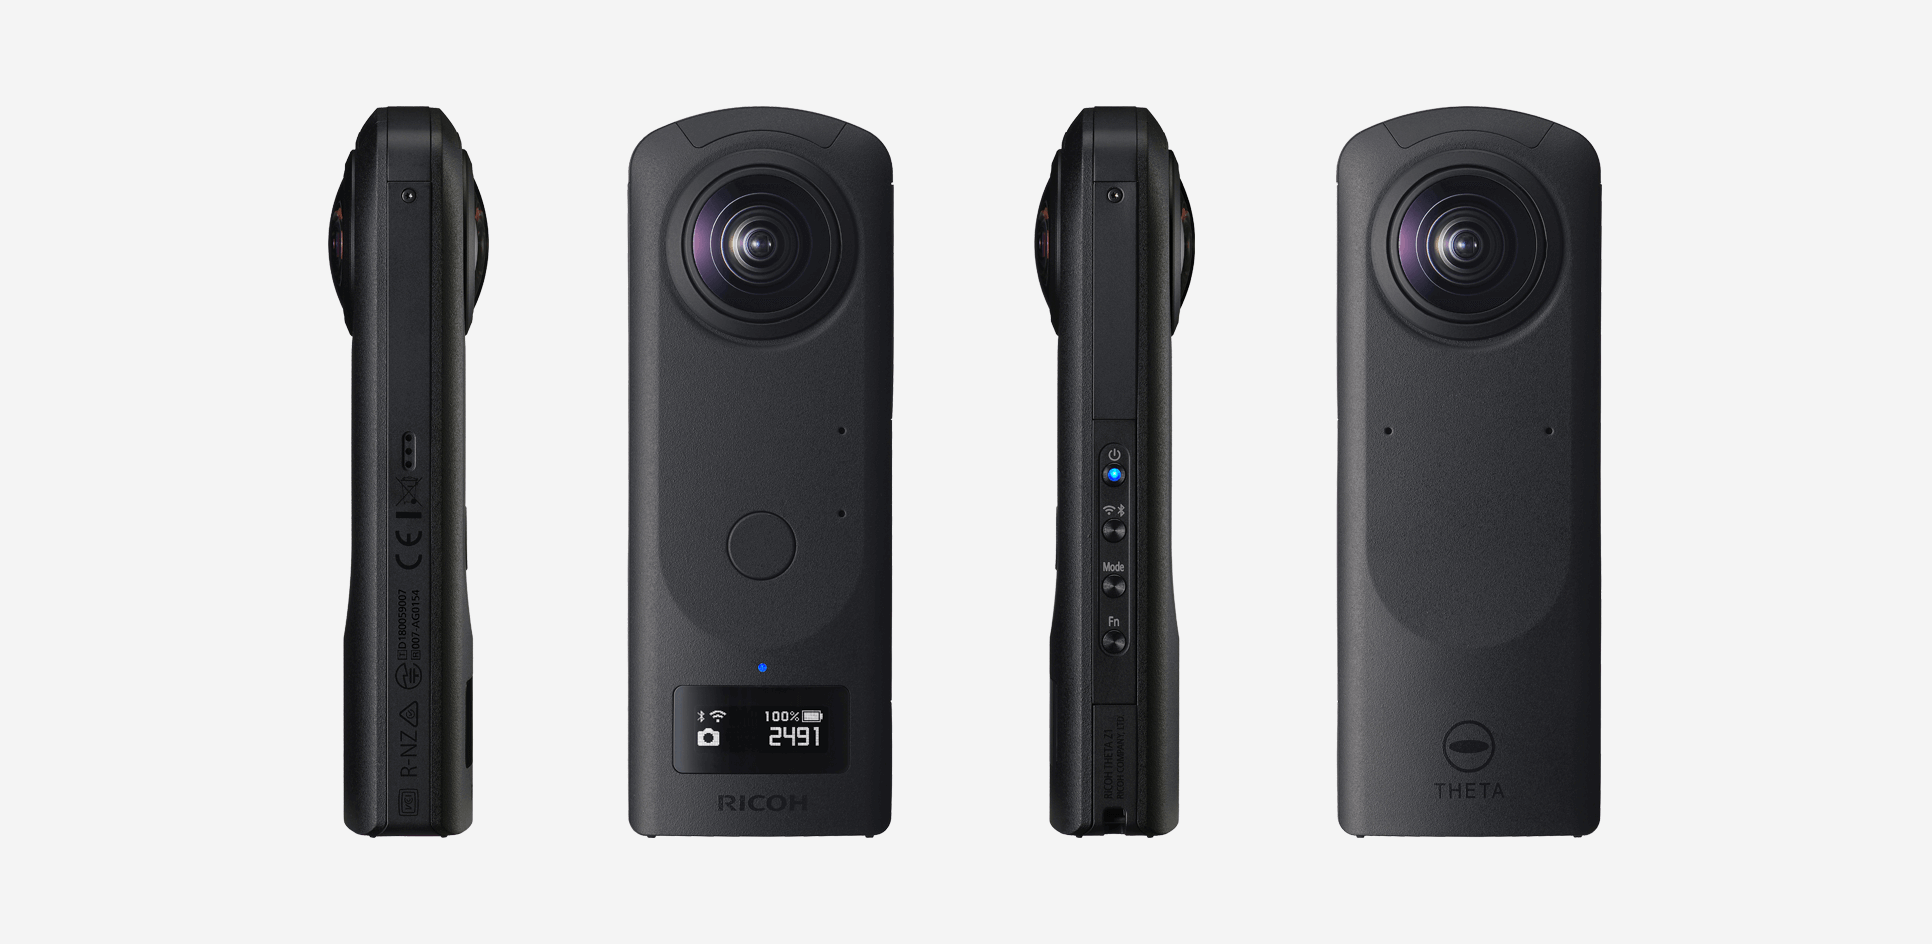
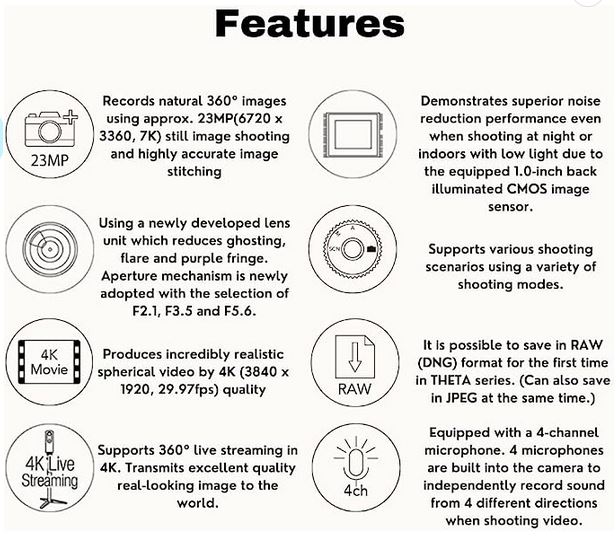
https://theta360.com/en/about/theta/z1.html
Theta Z1 is Ricoh’s flagship 360 camera that features 1-inch sensors, which are the largest available for dual lens 360 cameras. It has been a highly regarded camera among 360 photographers because of its excellent image quality, color accuracy, and its ability to shoot Raw DNG photos with exceptional exposure latitude.
Bracketing mode 2022
Rquirement: Basic app iOS ver.2.20.0, Android ver.2.5.0, Camera firmware ver.2.10.3
https://community.theta360.guide/t/new-feature-ae-bracket-added-in-the-shooting-mode-z1-only/8247
HDRi for VFX
https://community.theta360.guide/t/create-high-quality-hdri-for-vfx-using-ricoh-theta-z1/4789/4
ND filtering
https://community.theta360.guide/t/neutral-density-solution-for-most-theta-cameras/7331
https://community.theta360.guide/t/long-exposure-nd-filter-for-ricoh-theta/1100
https://pyimagesearch.com/2017/08/28/fast-optimized-for-pixel-loops-with-opencv-and-python/
https://learnopencv.com/exposure-fusion-using-opencv-cpp-python/
Exposure Fusion is a method for combining images taken with different exposure settings into one image that looks like a tone mapped High Dynamic Range (HDR) image.

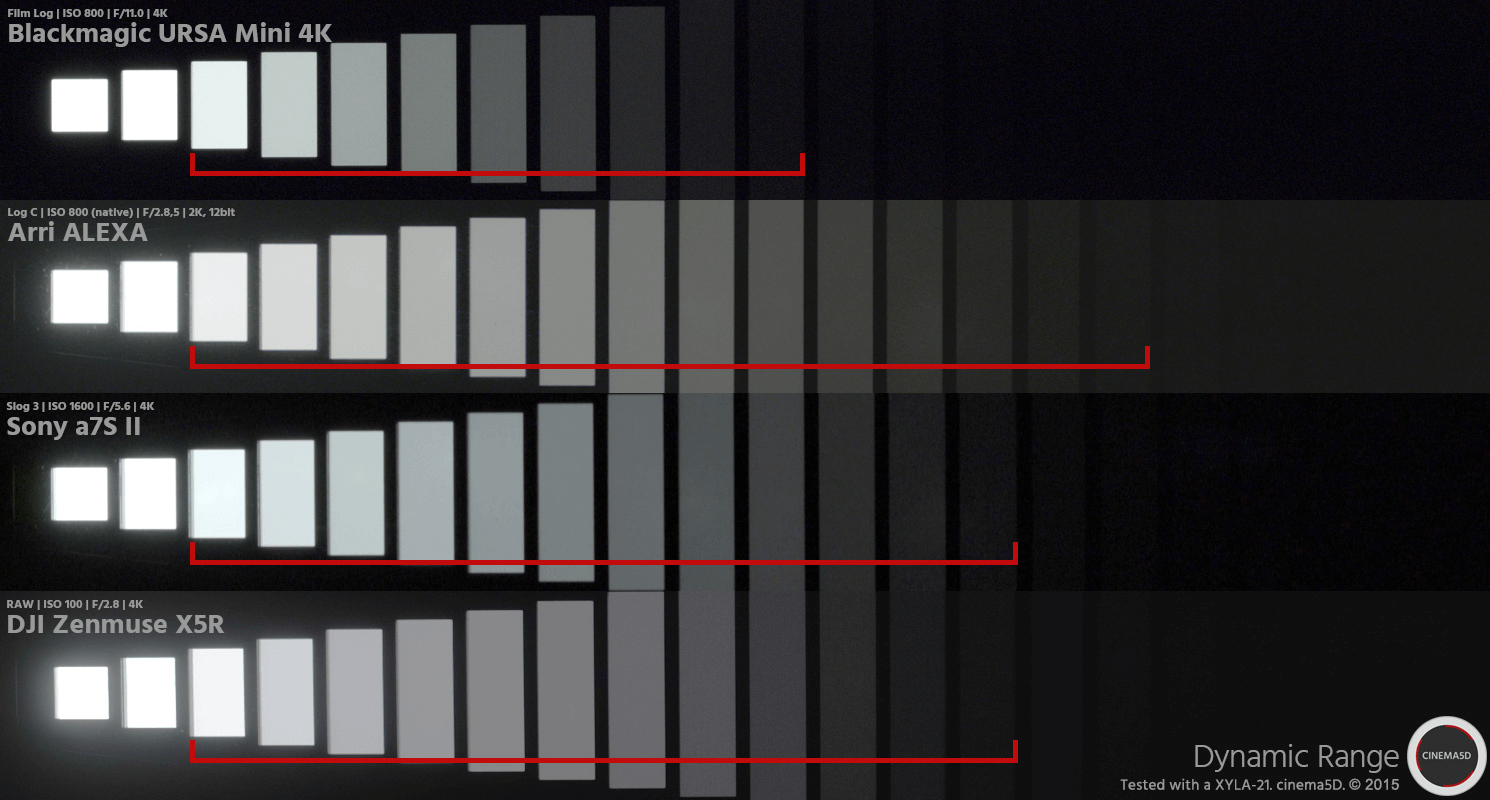
https://www.studiobinder.com/blog/what-is-dynamic-range-photography/
https://www.hdrsoft.com/resources/dri.html#bit-depth

The dynamic range is a ratio between the maximum and minimum values of a physical measurement. Its definition depends on what the dynamic range refers to.
For a scene: Dynamic range is the ratio between the brightest and darkest parts of the scene.
For a camera: Dynamic range is the ratio of saturation to noise. More specifically, the ratio of the intensity that just saturates the camera to the intensity that just lifts the camera response one standard deviation above camera noise.
For a display: Dynamic range is the ratio between the maximum and minimum intensities emitted from the screen.


“We encourage our employees, in addition to their regular projects, to spend 20% of their time working on what they think will most benefit Google,”
www.fxguide.com/fxfeatured/the-definitive-weta-digital-guide-to-ibl
Notes:
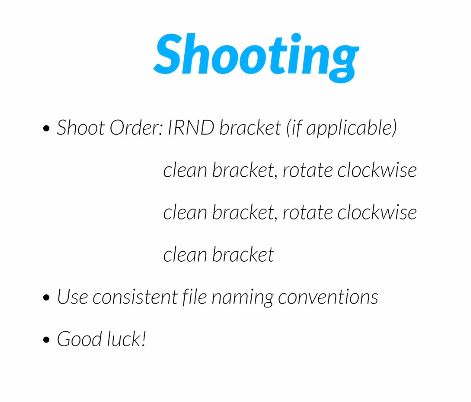
NOTE: The goal is to clean the initial individual brackets before or at merging time as much as possible.
This means:
www.colour-science.org/posts/the-colorchecker-considered-mostly-harmless/
“Unless you have all the relevant spectral measurements, a colour rendition chart should not be used to perform colour-correction of camera imagery but only for white balancing and relative exposure adjustments.”
“Using a colour rendition chart for colour-correction might dramatically increase error if the scene light source spectrum is different from the illuminant used to compute the colour rendition chart’s reference values.”
“other factors make using a colour rendition chart unsuitable for camera calibration:
– Uncontrolled geometry of the colour rendition chart with the incident illumination and the camera.
– Unknown sample reflectances and ageing as the colour of the samples vary with time.
– Low samples count.
– Camera noise and flare.
– Etc…
“Those issues are well understood in the VFX industry, and when receiving plates, we almost exclusively use colour rendition charts to white balance and perform relative exposure adjustments, i.e. plate neutralisation.”
www.xuanprada.com/blog/2014/11/3/hdri-shooting
http://blog.gregzaal.com/2016/03/16/make-your-own-hdri/
http://blog.hdrihaven.com/how-to-create-high-quality-hdri/
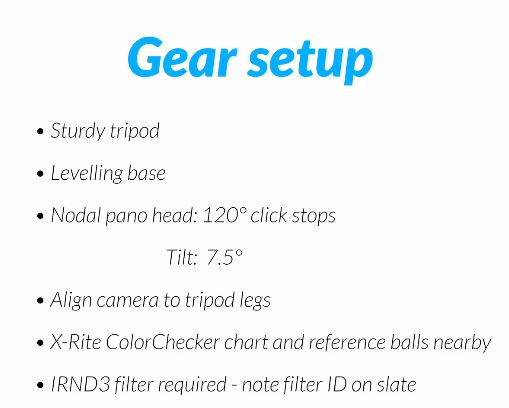
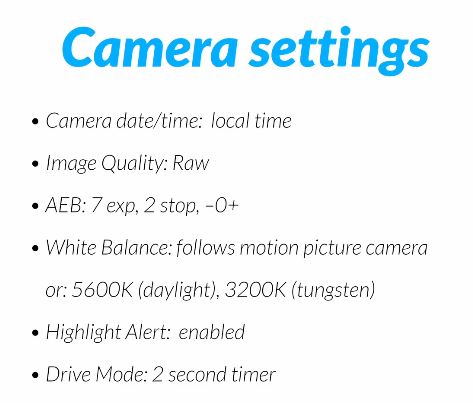
Shooting checklist
Methodology
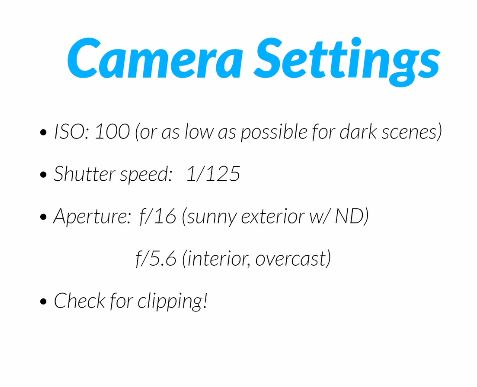
Exposures starting point
NOTE: The goal is to clean the initial individual brackets before or at merging time as much as possible.
This means:

Here are the tips for using the chromatic ball in VFX projects, written in English:
https://www.linkedin.com/posts/bellrodrigo_here-are-the-tips-for-using-the-chromatic-activity-7200950595438940160-AGBp
Tips for Using the Chromatic Ball in VFX Projects**
The chromatic ball is an invaluable tool in VFX work, helping to capture lighting and reflection data crucial for integrating CGI elements seamlessly. Here are some tips to maximize its effectiveness:
1. **Positioning**:
– Place the chromatic ball in the same lighting conditions as the main subject. Ensure it is visible in the camera frame but not obstructing the main action.
– Ideally, place the ball where the CGI elements will be integrated to match the lighting and reflections accurately.
2. **Recording Reference Footage**:
– Capture reference footage of the chromatic ball at the beginning and end of each scene or lighting setup. This ensures you have consistent lighting data for the entire shoot.
3. **Consistent Angles**:
– Use consistent camera angles and heights when recording the chromatic ball. This helps in comparing and matching lighting setups across different shots.
4. **Combine with a Gray Ball**:
– Use a gray ball alongside the chromatic ball. The gray ball provides a neutral reference for exposure and color balance, complementing the chromatic ball’s reflection data.
5. **Marking Positions**:
– Mark the position of the chromatic ball on the set to ensure consistency when shooting multiple takes or different camera angles.
6. **Lighting Analysis**:
– Analyze the chromatic ball footage to understand the light sources, intensity, direction, and color temperature. This information is crucial for creating realistic CGI lighting and shadows.
7. **Reflection Analysis**:
– Use the chromatic ball to capture the environment’s reflections. This helps in accurately reflecting the CGI elements within the same scene, making them blend seamlessly.
8. **Use HDRI**:
– Capture High Dynamic Range Imagery (HDRI) of the chromatic ball. HDRI provides detailed lighting information and can be used to light CGI scenes with greater realism.
9. **Communication with VFX Team**:
– Ensure that the VFX team is aware of the chromatic ball’s data and how it was captured. Clear communication ensures that the data is used effectively in post-production.
10. **Post-Production Adjustments**:
– In post-production, use the chromatic ball data to adjust the CGI elements’ lighting and reflections. This ensures that the final output is visually cohesive and realistic.
www.hdrlabs.com/picturenaut/plugins.html

Note. The Median Cut algorithm is typically used for color quantization, which involves reducing the number of colors in an image while preserving its visual quality. It doesn’t directly provide a way to identify the brightest areas in an image. However, if you’re interested in identifying the brightest areas, you might want to look into other methods like thresholding, histogram analysis, or edge detection, through openCV for example.
Here is an openCV example:
# bottom left coordinates = 0,0
import numpy as np
import cv2

# Load the HDR or EXR image
image = cv2.imread('your_image_path.exr', cv2.IMREAD_UNCHANGED)  # Load as-is without modification

# Calculate the luminance from the HDR channels (assuming RGB format)
luminance = np.dot(image[..., :3], [0.299, 0.587, 0.114])

# Set a threshold value based on estimated EV
threshold_value = 2.4  # Estimated threshold value based on 4.8 EV

# Apply the threshold to identify bright areas
# The luminance array contains the calculated luminance values for each pixel in the image. # The threshold_value is a user-defined value that represents a cutoff point, separating "bright" and "dark" areas in terms of perceived luminance.
thresholded = (luminance > threshold_value) * 255

# Convert the thresholded image to uint8 for contour detection
thresholded = thresholded.astype(np.uint8)

# Find contours of the bright areas
contours, _ = cv2.findContours(thresholded, cv2.RETR_EXTERNAL, cv2.CHAIN_APPROX_SIMPLE)

# Create a list to store the bounding boxes of bright areas
bright_areas = []

# Iterate through contours and extract bounding boxes for contour in contours:
x, y, w, h = cv2.boundingRect(contour)

# Adjust y-coordinate based on bottom-left origin
y_bottom_left_origin = image.shape[0] - (y + h) bright_areas.append((x, y_bottom_left_origin, x + w, y_bottom_left_origin + h))

# Store as (x1, y1, x2, y2)
# Print the identified bright areas
print("Bright Areas (x1, y1, x2, y2):") for area in bright_areas: print(area)
More details
Luminance and Exposure in an EXR Image:
The luminance line is calculating the luminance of each pixel in the image using a weighted sum of the red, green, and blue channels. The three float values [0.299, 0.587, 0.114] are the weights used to perform this calculation.
These weights are based on the concept of luminosity, which aims to approximate the perceived brightness of a color by taking into account the human eye’s sensitivity to different colors. The values are often derived from the NTSC (National Television System Committee) standard, which is used in various color image processing operations.
Here’s the breakdown of the float values:
The weighted sum of these channels helps create a grayscale image where the pixel values represent the perceived brightness. This technique is often used when converting a color image to grayscale or when calculating luminance for certain operations, as it takes into account the human eye’s sensitivity to different colors.
For the threshold, remember that the exact relationship between EV values and pixel values can depend on the tone-mapping or normalization applied to the HDR image, as well as the dynamic range of the image itself.
To establish a relationship between exposure and the threshold value, you can consider the relationship between linear and logarithmic scales:
threshold_value = base_value * (2 ** EV)
Here, EV is the exposure value, base_value is a scaling factor that determines the relationship between EV and threshold_value, and 2 ** EV is used to convert the logarithmic EV to a linear intensity value.
base_value factor should be determined based on the dynamic range of your EXR image and the specific luminance values you are dealing with.base_value to achieve the desired separation of bright areas from the rest of the image.
Let’s say you have an EXR image with a dynamic range of 12 EV, which is a common range for many high dynamic range images. In this case, you want to set a threshold value that corresponds to a certain number of EV above the middle gray level (which is often considered to be around 0.18).
Here’s an example of how you might determine a base_value to achieve this:
# Define the dynamic range of the image in EV
dynamic_range = 12

# Choose the desired number of EV above middle gray for thresholding
desired_ev_above_middle_gray = 2

# Calculate the threshold value based on the desired EV above middle gray
threshold_value = 0.18 * (2 ** (desired_ev_above_middle_gray / dynamic_range))

print("Threshold Value:", threshold_value)
https://www.translatorscafe.com/unit-converter/en-US/illumination/1-11/

The power output of a light source is measured using the unit of watts W. This is a direct measure to calculate how much power the light is going to drain from your socket and it is not relatable to the light brightness itself.
The amount of energy emitted from it per second. That energy comes out in a form of photons which we can crudely represent with rays of light coming out of the source. The higher the power the more rays emitted from the source in a unit of time.
Not all energy emitted is visible to the human eye, so we often rely on photometric measurements, which takes in account the sensitivity of human eye to different wavelenghts


Details in the post
(more…)
Photo editing
skylum.com/luminar
Photo editing
photolemur.com/
Photo editing
https://skylum.com/aurorahdr
Noise reduction
https://skylum.com/noiseless
Noise reduction
https://www.picturecode.com/showcase/noise.php
Noise reduction
https://topazlabs.com/denoise-ai/
Noise reduction
https://ni.neatvideo.com/examples#kingfisher
Color picker/editor
www.ricoholmes.com/cc-hover-color-picker.html
Texturing
digitalanarchy.com/demos/textureanarchy.html
Photo enhancer
cc-extensions.com/products/alce/
Photo sharpner
https://topazlabs.com/sharpen-ai/
Custom guides
guideguide.me/
Photo editor
www.on1.com/products/effects/
Image scaler
exposure.software/blowup/
Particle support
www.painterartist.com/en/product/particleshop/
Edge enhancer
fixelalgorithms.co/products/edgehancer3/
Jpeg to Raw
https://topazlabs.com/jpeg-to-raw-ai/
Animation editor
https://exchange.adobe.com/creativecloud.details.100950.powtoon-extension-for-photoshop.html
Best free Actions collection
https://blog.spoongraphics.co.uk/freebies/12-free-cinematic-photo-effect-actions-adobe-photoshop
Add-ons collection
https://www.the-orange-box.com/photoshop-add-ons/
en.wikipedia.org/wiki/Go_motion
Petroleum jelly
This crude but reasonably effective technique involves smearing petroleum jelly (“Vaseline”) on a plate of glass in front of the camera lens, also known as vaselensing, then cleaning and reapplying it after each shot — a time-consuming process, but one which creates a blur around the model. This technique was used for the endoskeleton in The Terminator. This process was also employed by Jim Danforth to blur the pterodactyl’s wings in Hammer Films’ When Dinosaurs Ruled the Earth, and by Randal William Cook on the terror dogs sequence in Ghostbusters.[citation needed]
Bumping the puppet
Gently bumping or flicking the puppet before taking the frame will produce a slight blur; however, care must be taken when doing this that the puppet does not move too much or that one does not bump or move props or set pieces.
Moving the table
Moving the table on which the model is standing while the film is being exposed creates a slight, realistic blur. This technique was developed by Ladislas Starevich: when the characters ran, he moved the set in the opposite direction. This is seen in The Little Parade when the ballerina is chased by the devil. Starevich also used this technique on his films The Eyes of the Dragon, The Magical Clock and The Mascot. Aardman Animations used this for the train chase in The Wrong Trousers and again during the lorry chase in A Close Shave. In both cases the cameras were moved physically during a 1-2 second exposure. The technique was revived for the full-length Wallace & Gromit: The Curse of the Were-Rabbit.
Go motion
The most sophisticated technique was originally developed for the film The Empire Strikes Back and used for some shots of the tauntauns and was later used on films like Dragonslayer and is quite different from traditional stop motion. The model is essentially a rod puppet. The rods are attached to motors which are linked to a computer that can record the movements as the model is traditionally animated. When enough movements have been made, the model is reset to its original position, the camera rolls and the model is moved across the table. Because the model is moving during shots, motion blur is created.
A variation of go motion was used in E.T. the Extra-Terrestrial to partially animate the children on their bicycles.
A light wave that is vibrating in more than one plane is referred to as unpolarized light. …
Polarized light waves are light waves in which the vibrations occur in a single plane. The process of transforming unpolarized light into polarized light is known as polarization.

en.wikipedia.org/wiki/Polarizing_filter_(photography)
The most common use of polarized technology is to reduce lighting complexity on the subject.
Details such as glare and hard edges are not removed, but greatly reduced.
This method is usually used in VFX to capture raw images with the least amount of specular diffusion or pollution, thus allowing artists to infer detail back through typical shading and rendering techniques and on demand.
Light reflected from a non-metallic surface becomes polarized; this effect is maximum at Brewster’s angle, about 56° from the vertical for common glass.
A polarizer rotated to pass only light polarized in the direction perpendicular to the reflected light will absorb much of it. This absorption allows glare reflected from, for example, a body of water or a road to be reduced. Reflections from shiny surfaces (e.g. vegetation, sweaty skin, water surfaces, glass) are also reduced. This allows the natural color and detail of what is beneath to come through. Reflections from a window into a dark interior can be much reduced, allowing it to be seen through. (The same effects are available for vision by using polarizing sunglasses.)

www.physicsclassroom.com/class/light/u12l1e.cfm
Some of the light coming from the sky is polarized (bees use this phenomenon for navigation). The electrons in the air molecules cause a scattering of sunlight in all directions. This explains why the sky is not dark during the day. But when looked at from the sides, the light emitted from a specific electron is totally polarized.[3] Hence, a picture taken in a direction at 90 degrees from the sun can take advantage of this polarization.

Use of a polarizing filter, in the correct direction, will filter out the polarized component of skylight, darkening the sky; the landscape below it, and clouds, will be less affected, giving a photograph with a darker and more dramatic sky, and emphasizing the clouds.

There are two types of polarizing filters readily available, linear and “circular”, which have exactly the same effect photographically. But the metering and auto-focus sensors in certain cameras, including virtually all auto-focus SLRs, will not work properly with linear polarizers because the beam splitters used to split off the light for focusing and metering are polarization-dependent.
Polarizing filters reduce the light passed through to the film or sensor by about one to three stops (2–8×) depending on how much of the light is polarized at the filter angle selected. Auto-exposure cameras will adjust for this by widening the aperture, lengthening the time the shutter is open, and/or increasing the ASA/ISO speed of the camera.
www.adorama.com/alc/nd-filter-vs-polarizer-what%25e2%2580%2599s-the-difference
Neutral Density (ND) filters help control image exposure by reducing the light that enters the camera so that you can have more control of your depth of field and shutter speed. Polarizers or polarizing filters work in a similar way, but the difference is that they selectively let light waves of a certain polarization pass through. This effect helps create more vivid colors in an image, as well as manage glare and reflections from water surfaces. Both are regarded as some of the best filters for landscape and travel photography as they reduce the dynamic range in high-contrast images, thus enabling photographers to capture more realistic and dramatic sceneries.
shopfelixgray.com/blog/polarized-vs-non-polarized-sunglasses/
www.eyebuydirect.com/blog/difference-polarized-nonpolarized-sunglasses/

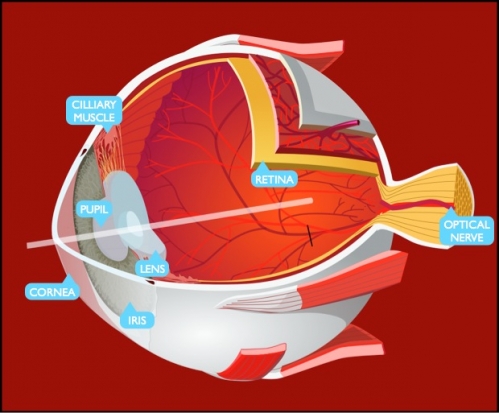
https://www.quora.com/What-is-the-comparison-between-the-human-eye-and-a-digital-camera
https://medium.com/hipster-color-science/a-beginners-guide-to-colorimetry-401f1830b65a
There are three types of cone photoreceptors in the eye, called Long, Medium and Short. These contribute to color discrimination. They are all sensitive to different, yet overlapping, wavelengths of light. They are commonly associated with the color they are most sensitive too, L = red, M = green, S = blue.
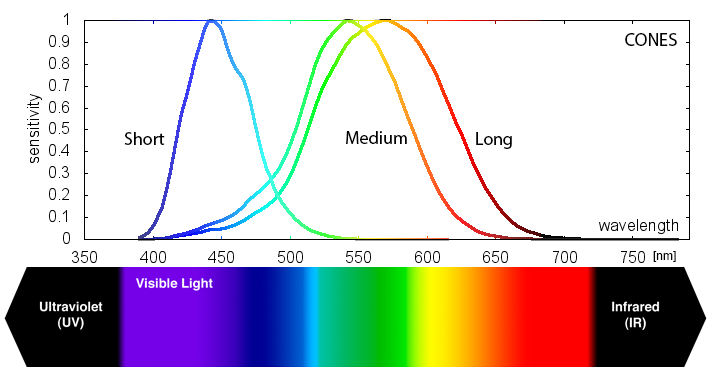
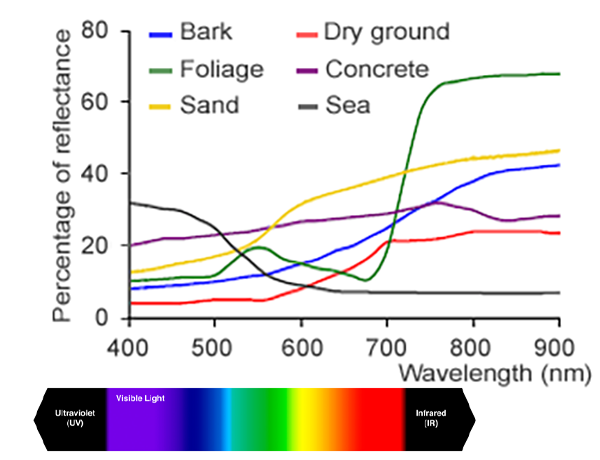
Different spectral distributions can stimulate the cones in the exact same way
A leaf and a green car that look the same to you, but physically have different reflectance properties. It turns out every color (or, unique cone output) can be created from many different spectral distributions. Color science starts to make a lot more sense when you understand this.
When you view the charts overlaid, you can see that the spinach mostly reflects light outside of the eye’s visual range, and inside our range it mostly reflects light centered around our M cone.
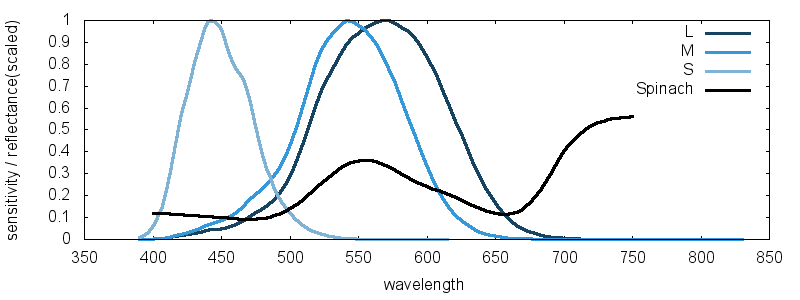
This phenomenon is called metamerism and it has huge ramifications for color reproduction. It means we don’t need the original light to reproduce an observed color.
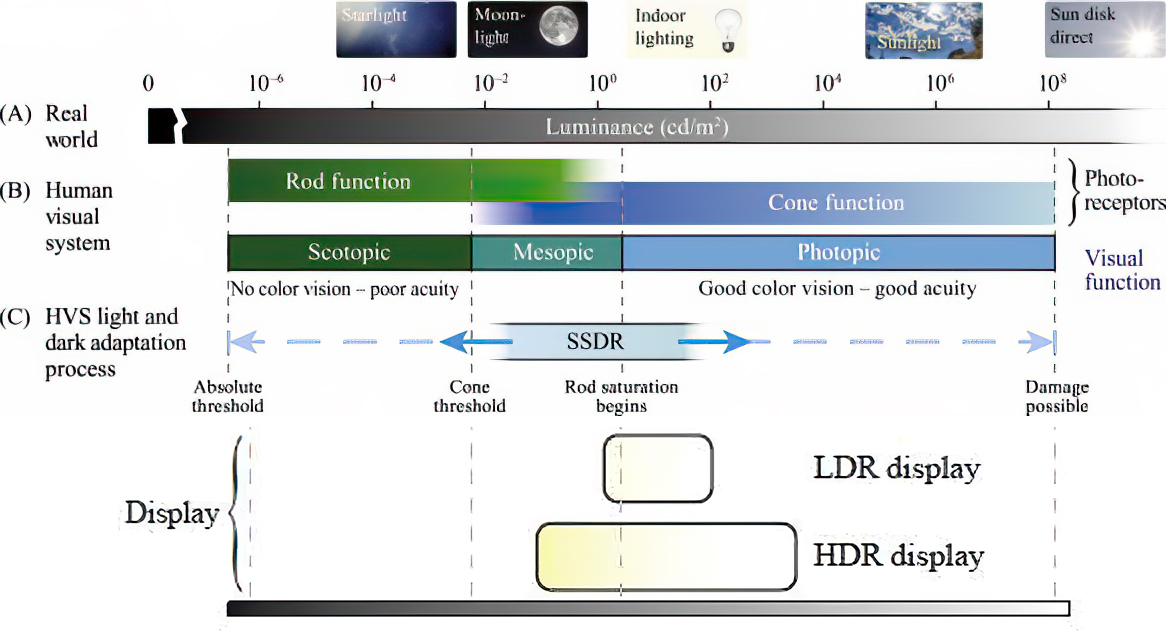
http://www.absoluteastronomy.com/topics/Adaptation_%28eye%29
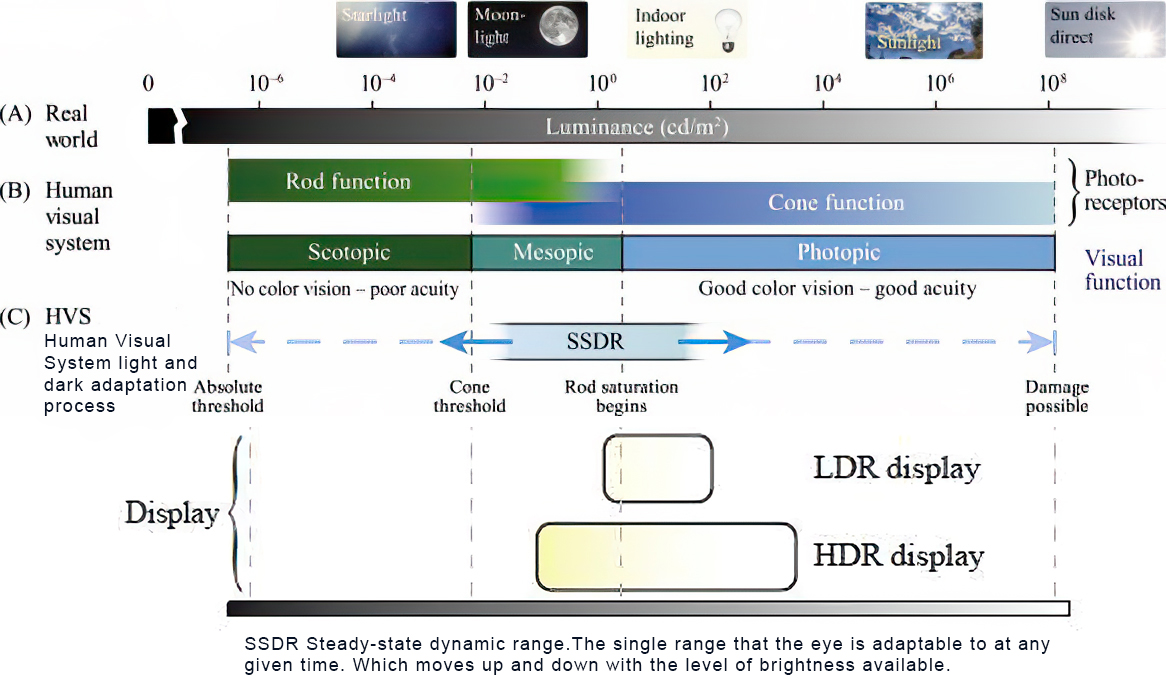
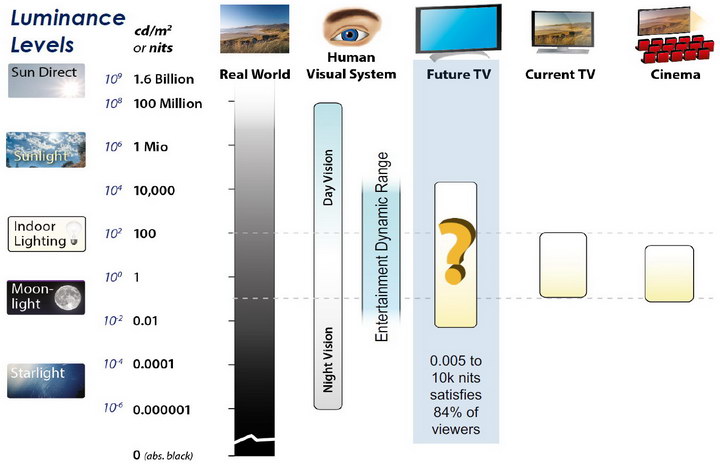
The human eye can function from very dark to very bright levels of light; its sensing capabilities reach across nine orders of magnitude. This means that the brightest and the darkest light signal that the eye can sense are a factor of roughly 1,000,000,000 apart. However, in any given moment of time, the eye can only sense a contrast ratio of one thousand. What enables the wider reach is that the eye adapts its definition of what is black. The light level that is interpreted as “black” can be shifted across six orders of magnitude—a factor of one million.
https://clarkvision.com/articles/eye-resolution.html
The Human eye is able to function in bright sunlight and view faint starlight, a range of more than 100 million to one. The Blackwell (1946) data covered a brightness range of 10 million and did not include intensities brighter than about the full Moon. The full range of adaptability is on the order of a billion to 1. But this is like saying a camera can function over a similar range by adjusting the ISO gain, aperture and exposure time.
In any one view, the eye eye can see over a 10,000 range in contrast detection, but it depends on the scene brightness, with the range decreasing with lower contrast targets. The eye is a contrast detector, not an absolute detector like the sensor in a digital camera, thus the distinction. The range of the human eye is greater than any film or consumer digital camera.
As for DSLR cameras’ contrast ratio ranges in 2048:1.
(Daniel Frank) Several key differences stand out for me (among many):
When collecting hdri make sure the data supports basic metadata, such as:
In image processing, computer graphics, and photography, high dynamic range imaging (HDRI or just HDR) is a set of techniques that allow a greater dynamic range of luminances (a Photometry measure of the luminous intensity per unit area of light travelling in a given direction. It describes the amount of light that passes through or is emitted from a particular area, and falls within a given solid angle) between the lightest and darkest areas of an image than standard digital imaging techniques or photographic methods. This wider dynamic range allows HDR images to represent more accurately the wide range of intensity levels found in real scenes ranging from direct sunlight to faint starlight and to the deepest shadows.
The two main sources of HDR imagery are computer renderings and merging of multiple photographs, which in turn are known as low dynamic range (LDR) or standard dynamic range (SDR) images. Tone Mapping (Look-up) techniques, which reduce overall contrast to facilitate display of HDR images on devices with lower dynamic range, can be applied to produce images with preserved or exaggerated local contrast for artistic effect. Photography
In photography, dynamic range is measured in Exposure Values (in photography, exposure value denotes all combinations of camera shutter speed and relative aperture that give the same exposure. The concept was developed in Germany in the 1950s) differences or stops, between the brightest and darkest parts of the image that show detail. An increase of one EV or one stop is a doubling of the amount of light.
The human response to brightness is well approximated by a Steven’s power law, which over a reasonable range is close to logarithmic, as described by the Weber�Fechner law, which is one reason that logarithmic measures of light intensity are often used as well.
HDR is short for High Dynamic Range. It’s a term used to describe an image which contains a greater exposure range than the “black” to “white” that 8 or 16-bit integer formats (JPEG, TIFF, PNG) can describe. Whereas these Low Dynamic Range images (LDR) can hold perhaps 8 to 10 f-stops of image information, HDR images can describe beyond 30 stops and stored in 32 bit images.

https://www.hdrsoft.com/resources/dri.html#bit-depth
The dynamic range is a ratio between the maximum and minimum values of a physical measurement. Its definition depends on what the dynamic range refers to.
For a scene: Dynamic range is the ratio between the brightest and darkest parts of the scene.
For a camera: Dynamic range is the ratio of saturation to noise. More specifically, the ratio of the intensity that just saturates the camera to the intensity that just lifts the camera response one standard deviation above camera noise.
For a display: Dynamic range is the ratio between the maximum and minimum intensities emitted from the screen.
The Dynamic Range of real-world scenes can be quite high — ratios of 100,000:1 are common in the natural world. An HDR (High Dynamic Range) image stores pixel values that span the whole tonal range of real-world scenes. Therefore, an HDR image is encoded in a format that allows the largest range of values, e.g. floating-point values stored with 32 bits per color channel. Another characteristics of an HDR image is that it stores linear values. This means that the value of a pixel from an HDR image is proportional to the amount of light measured by the camera.
For TVs HDR is great, but it’s not the only new TV feature worth discussing.
Wide color gamut, or WCG, is often lumped in with HDR. While they’re often found together, they’re not intrinsically linked. Where HDR is an increase in the dynamic range of the picture (with contrast and brighter highlights in particular), a TV’s wide color gamut coverage refers to how much of the new, larger color gamuts a TV can display.
Wide color gamuts only really matter for HDR video sources like UHD Blu-rays and some streaming video, as only HDR sources are meant to take advantage of the ability to display more colors.
www.cnet.com/how-to/what-is-wide-color-gamut-wcg/
Color depth is only one aspect of color representation, expressing the precision with which the amount of each primary can be expressed through a pixel; the other aspect is how broad a range of colors can be expressed (the gamut)
Image rendering bit depth
Wide color gamuts include a greater number of colors than what most current TVs can display, so the greater a TV’s coverage of a wide color gamut, the more colors a TV will be able to reproduce.
When we talk about a color space or color gamut we refer to the range of color values stored in an image. The perception of these color also requires a display that has been tuned with to resolve these color profiles at best. This is often referred to as a ‘viewer lut’.
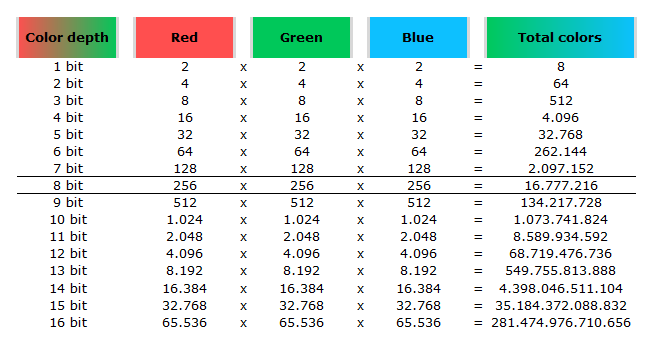
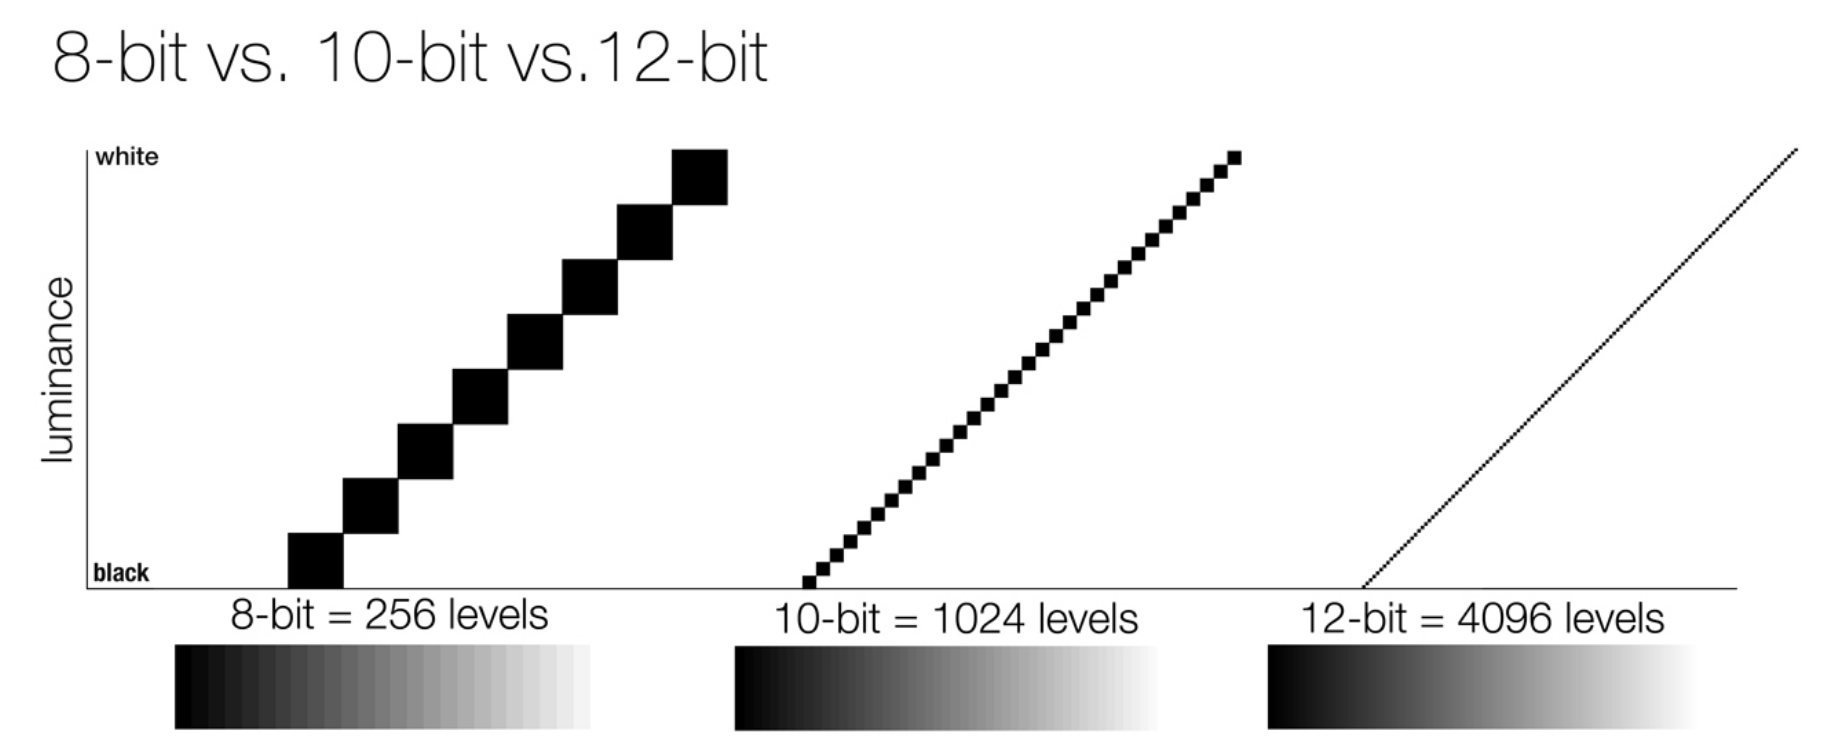
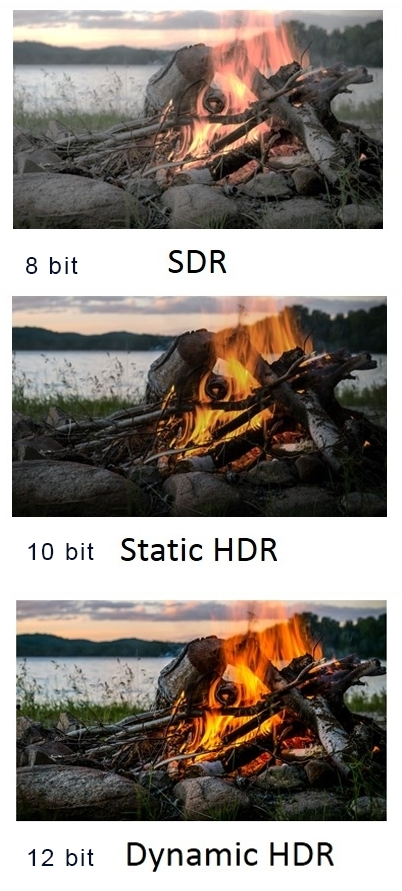
So this comes also usually paired with an increase in bit depth, going from the old 8 bit system (256 shades per color, with the potential of over 16.7 million colors: 256 green x 256 blue x 256 red) to 10 (1024+ shades per color, with access to over a billion colors) or higher bits, like 12 bit (4096 shades per RGB for 68 billion colors).
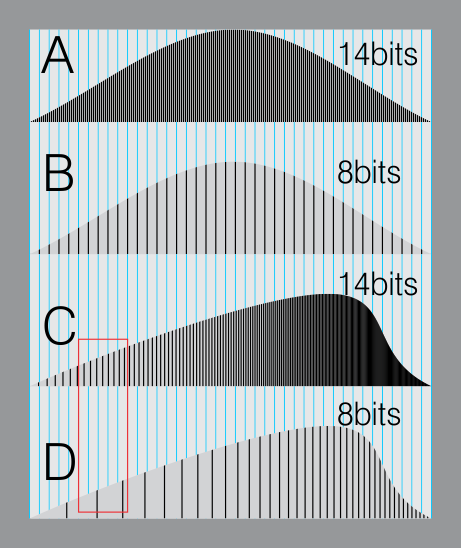
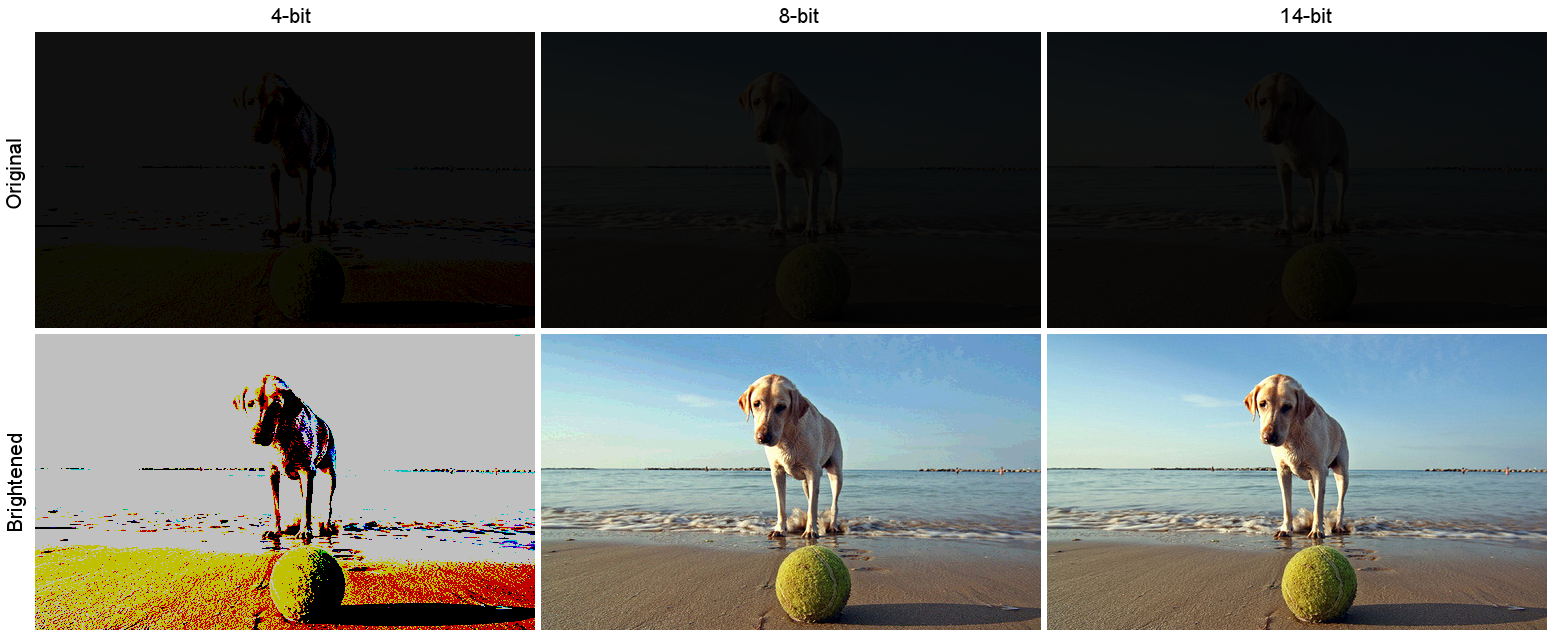
The advantage of higher bit depth is in the ability to bias color with the minimum loss.
For an extreme example, raising the brightness from a completely dark image allows for better reproduction, independently on the reproduction medium, due to the amount of data available at editing time:
For reference, 8-bit images (i.e. 24 bits per pixel for a color image) are considered Low Dynamic Range.
They can store around 5 stops of light and each pixel carry a value from 0 (black) to 255 (white).
As a comparison, DSLR cameras can capture ~12-15 stops of light and they use RAW files to store the information.
https://www.cambridgeincolour.com/tutorials/dynamic-range.htm
https://www.hdrsoft.com/resources/dri.html#bit-depth
Note that the number of bits itself may be a misleading indication of the real dynamic range that the image reproduces — converting a Low Dynamic Range image to a higher bit depth does not change its dynamic range, of course.
Also note that bit depth and dynamic range are often confused as one, but are indeed separate concepts and there is no direct one to one relationship between them. Bit depth is about capacity, dynamic range is about the actual ratio of data stored.
The bit depth of a capturing or displaying device gives you an indication of its dynamic range capacity. That is, the highest dynamic range that the device would be capable of reproducing if all other constraints are eliminated.
https://rawpedia.rawtherapee.com/Bit_Depth
Finally, note that there are two ways to “count” bits for an image — either the number of bits per color channel (BPC) or the number of bits per pixel (BPP). A bit (0,1) is the smallest unit of data stored in a computer.
For a grayscale image, 8-bit means that each pixel can be one of 256 levels of gray (256 is 2 to the power 8).
For an RGB color image, 8-bit means that each one of the three color channels can be one of 256 levels of color.
Since each pixel is represented by 3 colors in this case, 8-bit per color channel actually means 24-bit per pixel.
Similarly, 16-bit for an RGB image means 65,536 levels per color channel and 48-bit per pixel.
To complicate matters, when an image is classified as 16-bit, it just means that it can store a maximum 65,535 values. It does not necessarily mean that it actually spans that range. If the camera sensors can not capture more than 12 bits of tonal values, the actual bit depth of the image will be at best 12-bit and probably less because of noise.
The following table attempts to summarize the above for the case of an RGB color image.
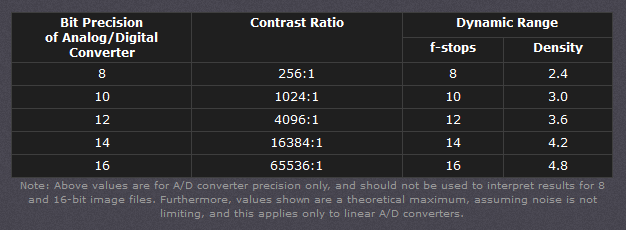
| Type of digital support | Bit depth per color channel | Bit depth per pixel | FStops | Theoretical maximum Dynamic Range | Reality |
|---|---|---|---|---|---|
| 8-bit | 8 | 24 | 8 | 256:1 | most consumer images |
| 12-bit CCD | 12 | 36 | 12 | 4,096:1 | real maximum limited by noise |
| 14-bit CCD | 14 | 42 | 14 | 16,384:1 | real maximum limited by noise |
| 16-bit TIFF (integer) | 16 | 48 | 16 | 65,536:1 | bit-depth in this case is not directly related to the dynamic range captured |
| 16-bit float EXR | 16 | 48 | 30 | 65,536:1 | values are distributed more closely in the (lower) darker tones than in the (higher) lighter ones, thus allowing for a more accurate description of the tones more significant to humans. The range of normalized 16-bit floats can represent thirty stops of information with 1024 steps per stop. We have eighteen and a half stops over middle gray, and eleven and a half below. The denormalized numbers provide an additional ten stops with decreasing precision per stop. http://download.nvidia.com/developer/GPU_Gems/CD_Image/Image_Processing/OpenEXR/OpenEXR-1.0.6/doc/#recs |
| HDR image (e.g. Radiance format) | 32 | 96 | “infinite” | 4.3 billion:1 | real maximum limited by the captured dynamic range |
32-bit floats are often called “single-precision” floats, and 64-bit floats are often called “double-precision” floats. 16-bit floats therefore are called “half-precision” floats, or just “half floats”.
https://petapixel.com/2018/09/19/8-12-14-vs-16-bit-depth-what-do-you-really-need
On a separate note, even Photoshop does not handle 16bit per channel. Photoshop does actually use 16-bits per channel. However, it treats the 16th digit differently – it is simply added to the value created from the first 15-digits. This is sometimes called 15+1 bits. This means that instead of 216 possible values (which would be 65,536 possible values) there are only 215+1 possible values (which is 32,768 +1 = 32,769 possible values).
Rec-601 (for the older SDTV format, very similar to rec-709) and Rec-709 (the HDTV’s recommended set of color standards, at times also referred to sRGB, although not exactly the same) are currently the most spread color formats and hardware configurations in the world.
Following those you can find the larger P3 gamut, more commonly used in theaters and in digital production houses (with small variations and improvements to color coverage), as well as most of best 4K/WCG TVs.
And a new standard is now promoted against P3, referred to Rec-2020 and UHDTV.

It is still debatable if this is going to be adopted at consumer level beyond the P3, mainly due to lack of hardware supporting it. But initial tests do prove that it would be a future proof investment.
www.colour-science.org/anders-langlands/
Rec. 2020 is ultimately designed for television, and not cinema. Therefore, it is to be expected that its properties must behave according to current signal processing standards. In this respect, its foundation is based on current HD and SD video signal characteristics.
As far as color bit depth is concerned, it allows for a maximum of 12 bits, which is more than enough for humans.
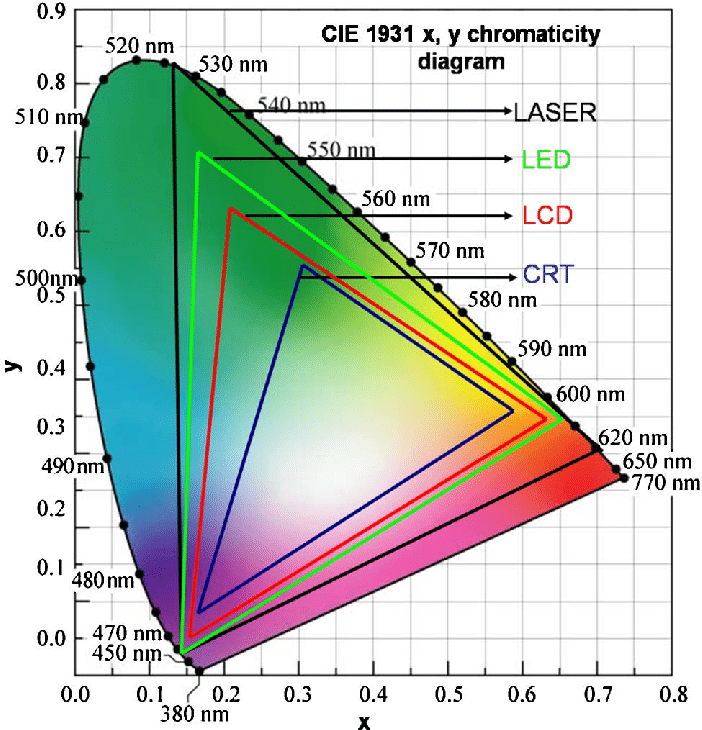
Comparing standards, REC-709 covers 35.9% of the human visible spectrum. P3 45.5%. And REC-2020 75.8%.
https://www.avsforum.com/forum/166-lcd-flat-panel-displays/2812161-what-color-volume.html
Comparing coverage to hardware devices
To note that all the new standards generally score very high on the Pointer’s Gamut chart. But with REC-2020 scoring 99.9% vs P3 at 88.2%.
www.tftcentral.co.uk/articles/pointers_gamut.htm
https://www.slideshare.net/hpduiker/acescg-a-common-color-encoding-for-visual-effects-applications
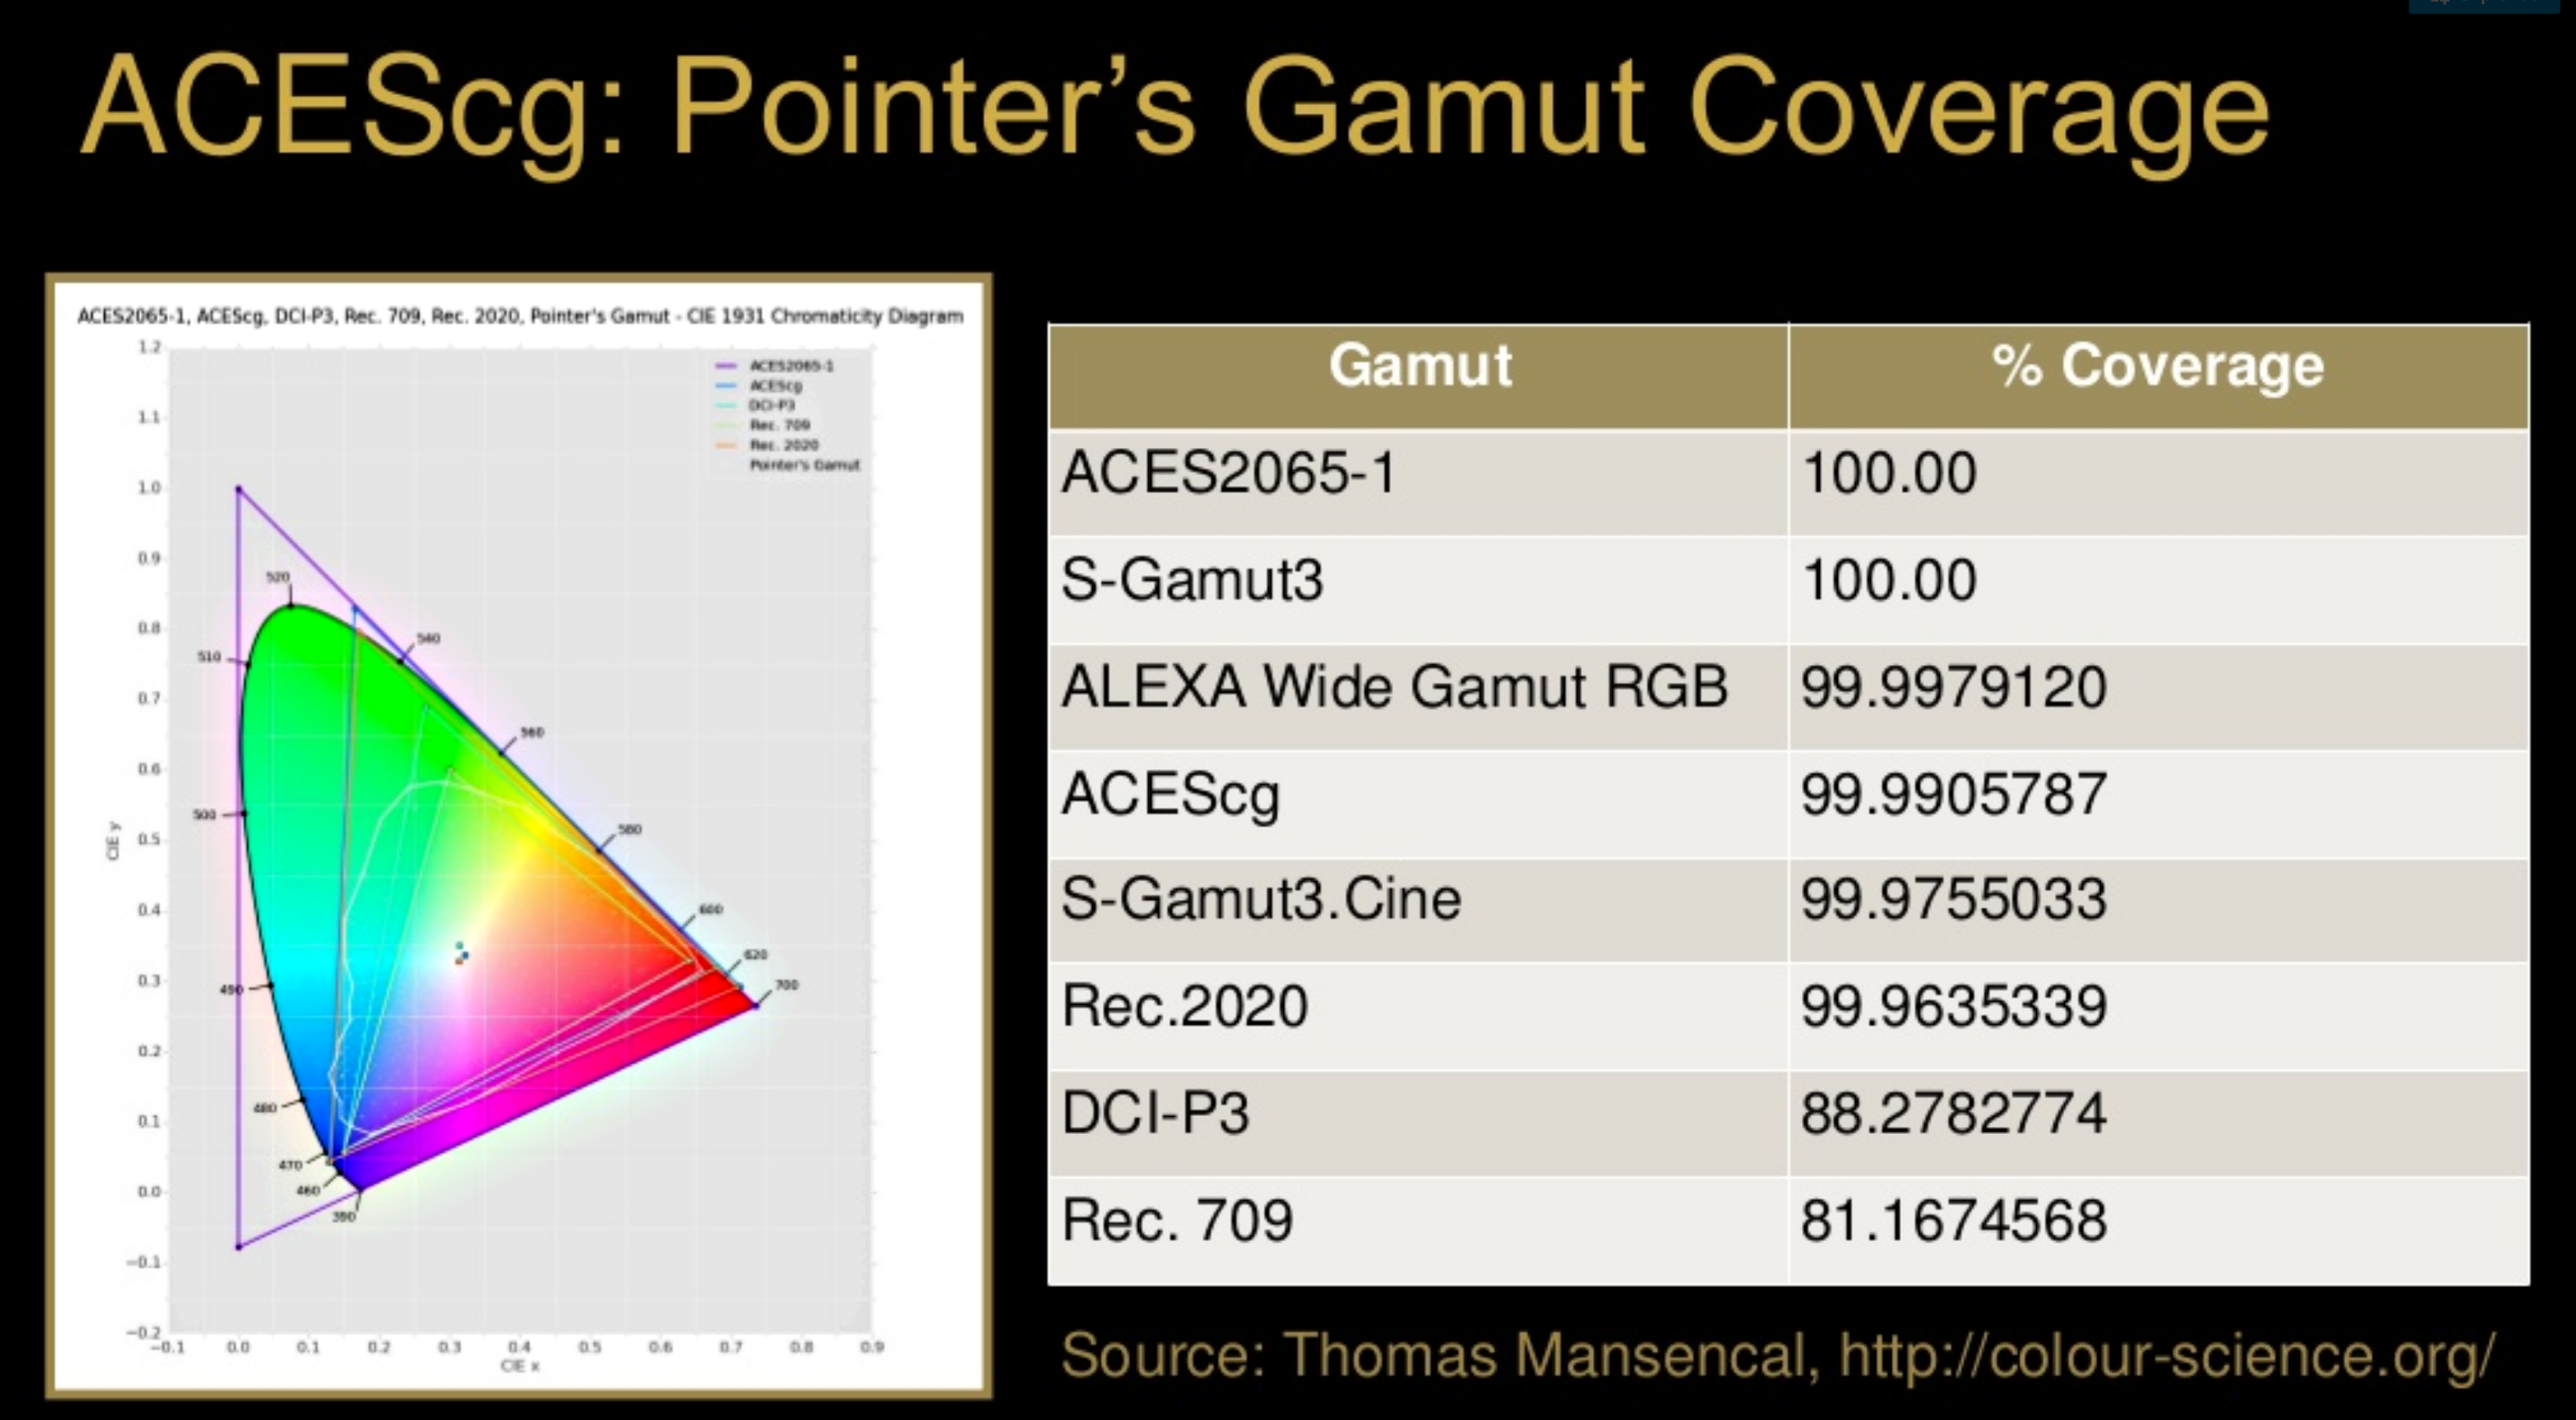
The Pointer’s gamut is (an approximation of) the gamut of real surface colors as can be seen by the human eye, based on the research by Michael R. Pointer (1980). What this means is that every color that can be reflected by the surface of an object of any material is inside the Pointer’s gamut. Basically establishing a widely respected target for color reproduction. Visually, Pointers Gamut represents the colors we see about us in the natural world. Colors outside Pointers Gamut include those that do not occur naturally, such as neon lights and computer-generated colors possible in animation. Which would partially be accounted for with the new gamuts.
cinepedia.com/picture/color-gamut/
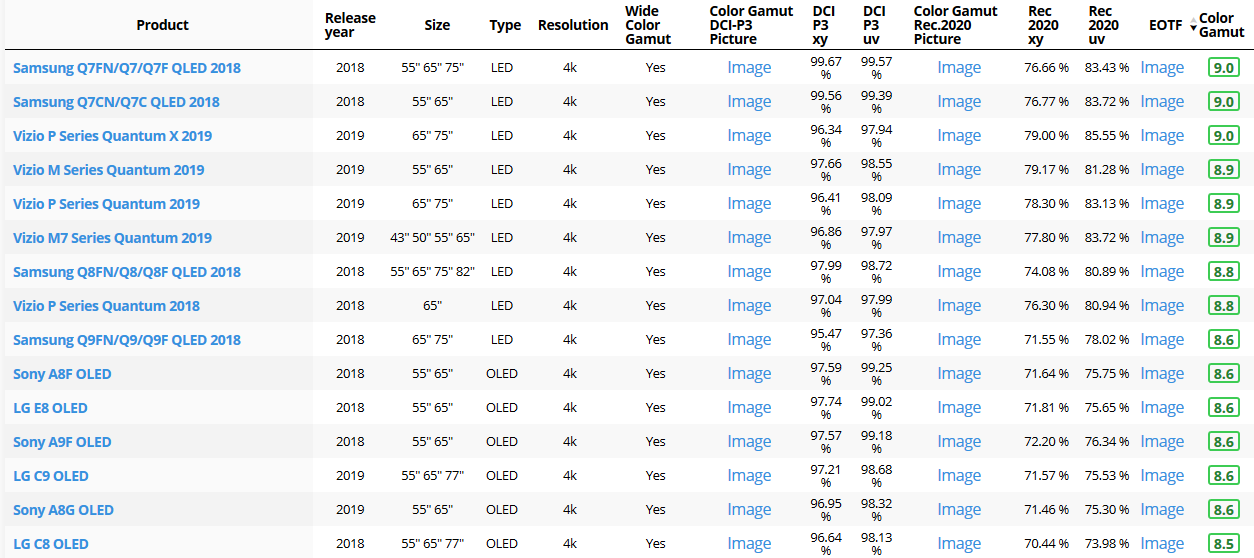
Not all current TVs can support the full spread of the new gamuts. Here is a list of modern TVs’ color coverage in percentage:
www.rtings.com/tv/tests/picture-quality/wide-color-gamut-rec-709-dci-p3-rec-2020
There are no TVs that can come close to displaying all the colors within Rec.2020, and there likely won’t be for at least a few years. However, to help future-proof the technology, Rec.2020 support is already baked into the HDR spec. That means that the same genuine HDR media that fills the DCI P3 space on a compatible TV now, will in a few years also fill Rec.2020 on a TV supporting that larger space.
Rec.2020’s main gains are in the number of new tones of green that it will display, though it also offers improvements to the number of blue and red colors as well. Altogether, Rec.2020 will cover about 75% of the visual spectrum, which is a sizeable increase in coverage even over DCI P3.
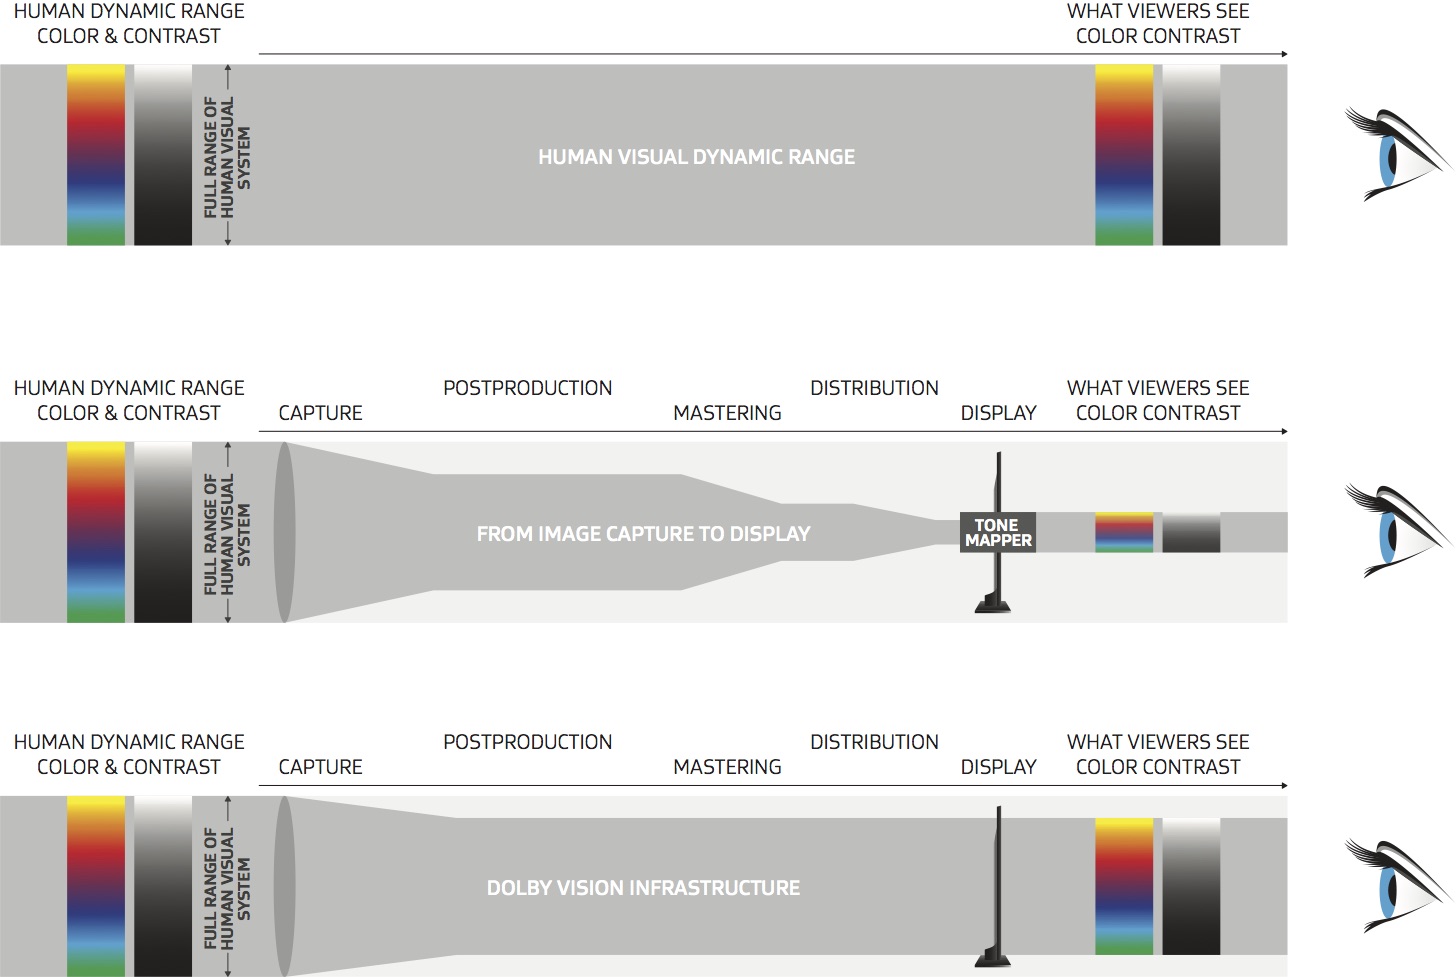
Dolby Vision
https://www.highdefdigest.com/news/show/what-is-dolby-vision/39049
https://www.techhive.com/article/3237232/dolby-vision-vs-hdr10-which-is-best.html
Dolby Vision is a proprietary end-to-end High Dynamic Range (HDR) format that covers content creation and playback through select cinemas, Ultra HD displays, and 4K titles. Like other HDR standards, the process uses expanded brightness to improve contrast between dark and light aspects of an image, bringing out deeper black levels and more realistic details in specular highlights — like the sun reflecting off of an ocean — in specially graded Dolby Vision material.
The iPhone 12 Pro gets the ability to record 4K 10-bit HDR video. According to Apple, it is the very first smartphone that is capable of capturing Dolby Vision HDR.
The iPhone 12 Pro takes two separate exposures and runs them through Apple’s custom image signal processor to create a histogram, which is a graph of the tonal values in each frame. The Dolby Vision metadata is then generated based on that histogram. In Laymen’s terms, it is essentially doing real-time grading while you are shooting. This is only possible due to the A14 Bionic chip.
Dolby Vision also allows for 12-bit color, as opposed to HDR10’s and HDR10+’s 10-bit color. While no retail TV we’re aware of supports 12-bit color, Dolby claims it can be down-sampled in such a way as to render 10-bit color more accurately.
Resources for more reading:
https://www.avsforum.com/forum/166-lcd-flat-panel-displays/2812161-what-color-volume.html
wolfcrow.com/say-hello-to-rec-2020-the-color-space-of-the-future/
www.cnet.com/news/ultra-hd-tv-color-part-ii-the-future/
COLLECTIONS
| Featured AI
| Design And Composition
| Explore posts
POPULAR SEARCHES
unreal | pipeline | virtual production | free | learn | photoshop | 360 | macro | google | nvidia | resolution | open source | hdri | real-time | photography basics | nuke
FEATURED POSTS
Social Links
DISCLAIMER – Links and images on this website may be protected by the respective owners’ copyright. All data submitted by users through this site shall be treated as freely available to share.


