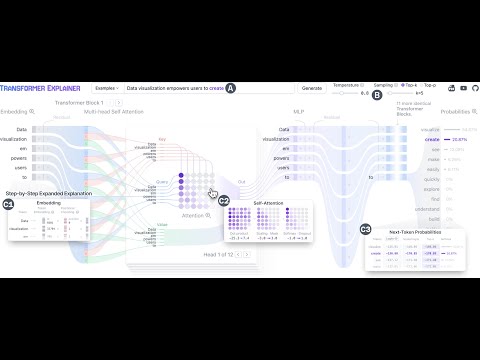
Transformer Explainer is an interactive visualization tool designed to help anyone learn how Transformer-based models like GPT work. It runs a live GPT-2 model right in your browser, allowing you to experiment with your own text and observe in real time how internal components and operations of the Transformer work together to predict the next tokens. Try Transformer Explainer at http://poloclub.github.io/transformer-explainer
If you prompt for a 360° video in VEO (like literally write “360°” ) it can generate a Monoscopic 360 video, then the next step is to inject the right metadata in your file so you can play it as an actual 360 video. Once it’s saved with the right Metadata, it will be recognized as an actual 360/VR video, meaning you can just play it in VLC and drag your mouse to look around.
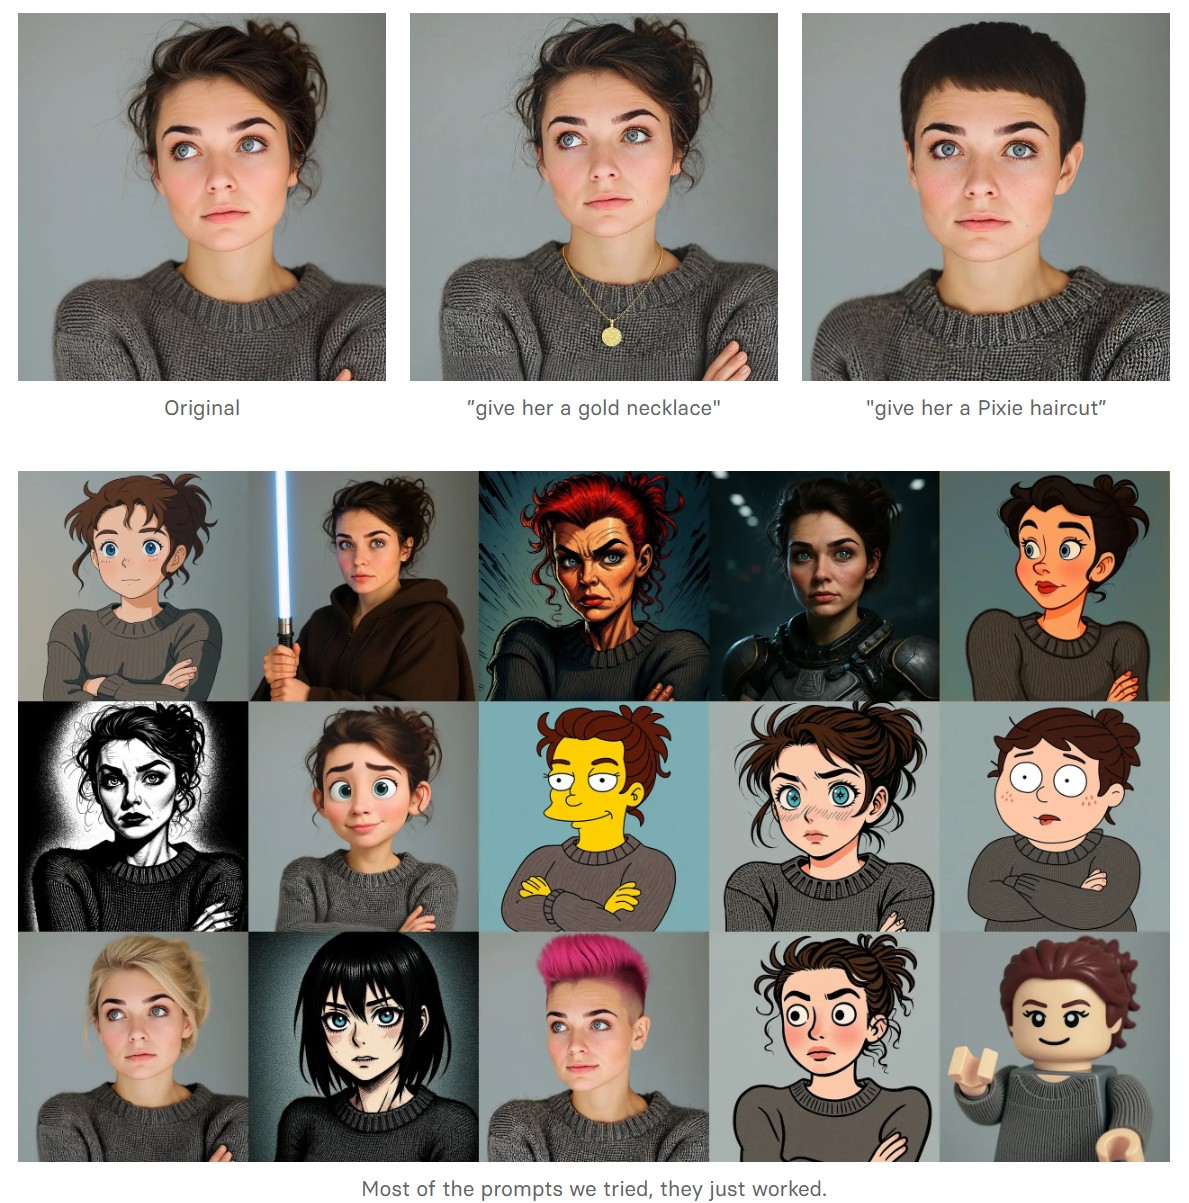
There are three models, two are available now, and a third open-weight version is coming soon:
FLUX.1 Kontext [pro]: State-of-the-art performance for image editing. High-quality outputs, great prompt following, and consistent results.
FLUX.1 Kontext [max]: A premium model that brings maximum performance, improved prompt adherence, and high-quality typography generation without compromise on speed.
Coming soon: FLUX.1 Kontext [dev]: An open-weight, guidance-distilled version of Kontext.
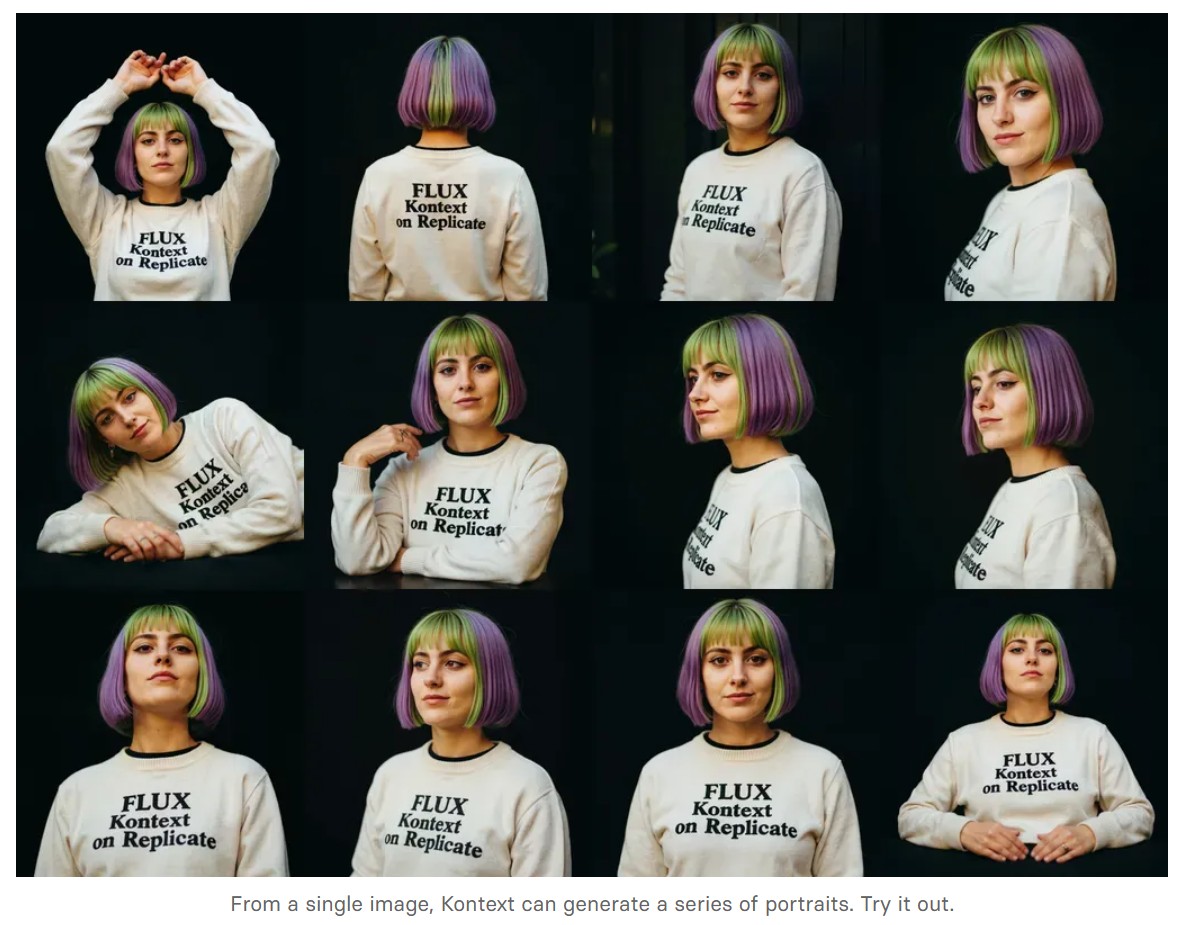
We’re so excited with what Kontext can do, we’ve created a collection of models on Replicate to give you ideas:
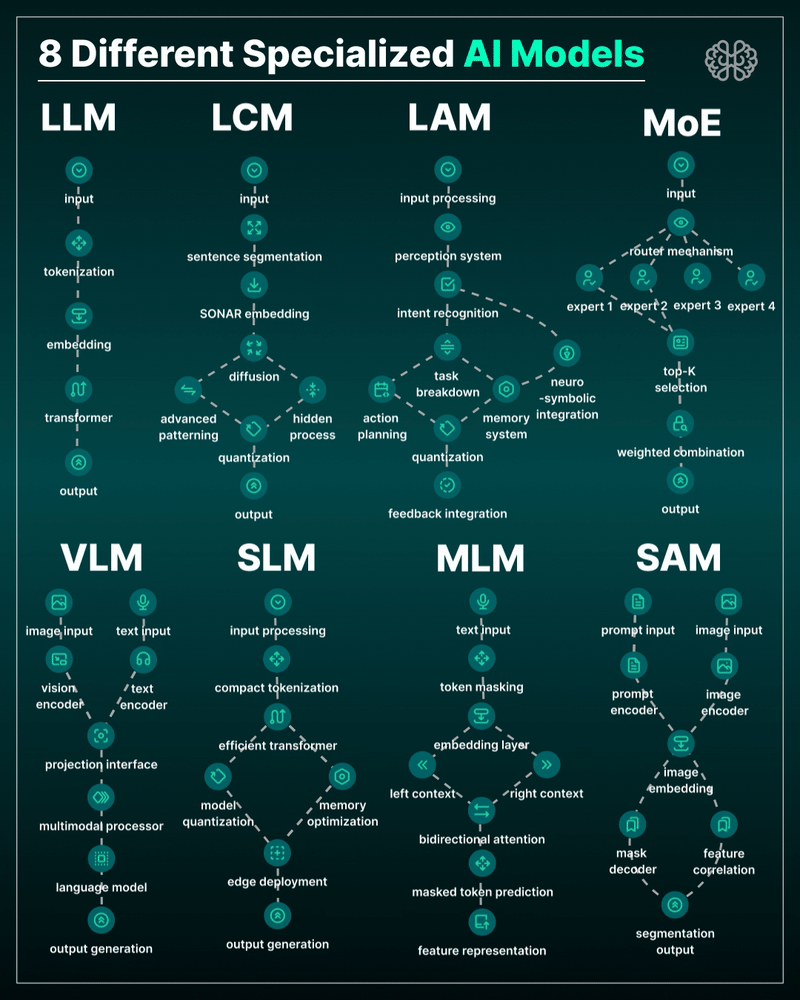
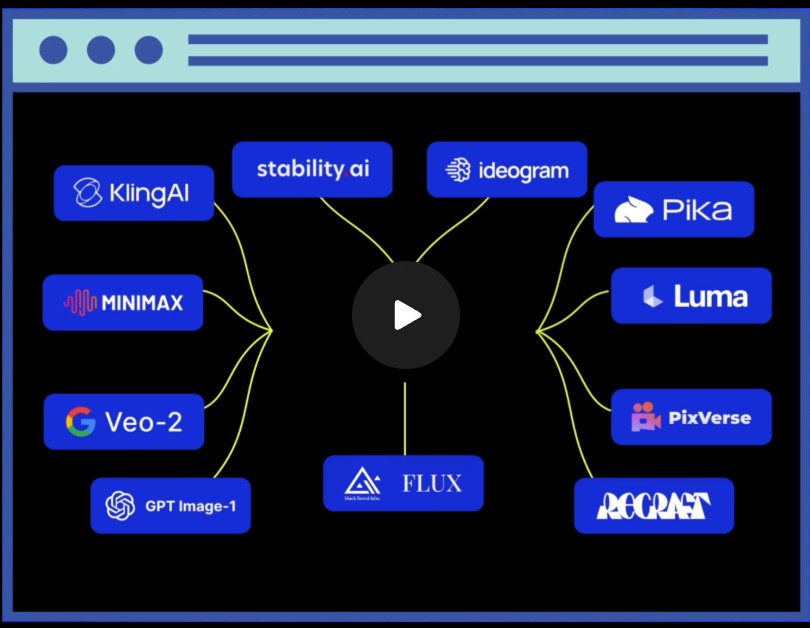
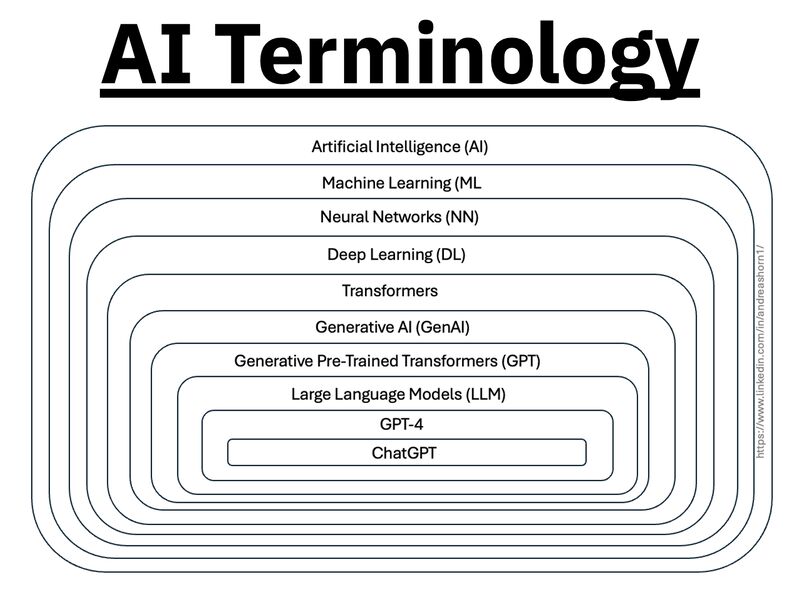
the 8 most important model types and what they’re actually built to do: ⬇️
1. 𝗟𝗟𝗠 – 𝗟𝗮𝗿𝗴𝗲 𝗟𝗮𝗻𝗴𝘂𝗮𝗴𝗲 𝗠𝗼𝗱𝗲𝗹 → Your ChatGPT-style model. Handles text, predicts the next token, and powers 90% of GenAI hype. 🛠 Use case: content, code, convos.
2. 𝗟𝗖𝗠 – 𝗟𝗮𝘁𝗲𝗻𝘁 𝗖𝗼𝗻𝘀𝗶𝘀𝘁𝗲𝗻𝗰𝘆 𝗠𝗼𝗱𝗲𝗹 → Lightweight, diffusion-style models. Fast, quantized, and efficient — perfect for real-time or edge deployment. 🛠 Use case: image generation, optimized inference.
3. 𝗟𝗔𝗠 – 𝗟𝗮𝗻𝗴𝘂𝗮𝗴𝗲 𝗔𝗰𝘁𝗶𝗼𝗻 𝗠𝗼𝗱𝗲𝗹 → Where LLM meets planning. Adds memory, task breakdown, and intent recognition. 🛠 Use case: AI agents, tool use, step-by-step execution.
4. 𝗠𝗼𝗘 – 𝗠𝗶𝘅𝘁𝘂𝗿𝗲 𝗼𝗳 𝗘𝘅𝗽𝗲𝗿𝘁𝘀 → One model, many minds. Routes input to the right “expert” model slice — dynamic, scalable, efficient. 🛠 Use case: high-performance model serving at low compute cost.
5. 𝗩𝗟𝗠 – 𝗩𝗶𝘀𝗶𝗼𝗻 𝗟𝗮𝗻𝗴𝘂𝗮𝗴𝗲 𝗠𝗼𝗱𝗲𝗹 → Multimodal beast. Combines image + text understanding via shared embeddings. 🛠 Use case: Gemini, GPT-4o, search, robotics, assistive tech.
6. 𝗦𝗟𝗠 – 𝗦𝗺𝗮𝗹𝗹 𝗟𝗮𝗻𝗴𝘂𝗮𝗴𝗲 𝗠𝗼𝗱𝗲𝗹 → Tiny but mighty. Designed for edge use, fast inference, low latency, efficient memory. 🛠 Use case: on-device AI, chatbots, privacy-first GenAI.
7. 𝗠𝗟𝗠 – 𝗠𝗮𝘀𝗸𝗲𝗱 𝗟𝗮𝗻𝗴𝘂𝗮𝗴𝗲 𝗠𝗼𝗱𝗲𝗹 → The OG foundation model. Predicts masked tokens using bidirectional context. 🛠 Use case: search, classification, embeddings, pretraining.
8. 𝗦𝗔𝗠 – 𝗦𝗲𝗴𝗺𝗲𝗻𝘁 𝗔𝗻𝘆𝘁𝗵𝗶𝗻𝗴 𝗠𝗼𝗱𝗲𝗹 → Vision model for pixel-level understanding. Highlights, segments, and understands *everything* in an image. 🛠 Use case: medical imaging, AR, robotics, visual agents.
While the human eye has red, green, and blue-sensing cones, those cones are cross-wired in the retina to produce a luminance channel plus a red-green and a blue-yellow channel, and it’s data in that color space (known technically as “LAB”) that goes to the brain. That’s why we can’t perceive a reddish-green or a yellowish-blue, whereas such colors can be represented in the RGB color space used by digital cameras.
The back of the retina is covered in light-sensitive neurons known as cone cells and rod cells. There are three types of cone cells, each sensitive to different ranges of light. These ranges overlap, but for convenience the cones are referred to as blue (short-wavelength), green (medium-wavelength), and red (long-wavelength). The rod cells are primarily used in low-light situations, so we’ll ignore those for now.
When light enters the eye and hits the cone cells, the cones get excited and send signals to the brain through the visual cortex. Different wavelengths of light excite different combinations of cones to varying levels, which generates our perception of color. You can see that the red cones are most sensitive to light, and the blue cones are least sensitive. The sensitivity of green and red cones overlaps for most of the visible spectrum.
Here’s how your brain takes the signals of light intensity from the cones and turns it into color information. To see red or green, your brain finds the difference between the levels of excitement in your red and green cones. This is the red-green channel.
To get “brightness,” your brain combines the excitement of your red and green cones. This creates the luminance, or black-white, channel. To see yellow or blue, your brain then finds the difference between this luminance signal and the excitement of your blue cones. This is the yellow-blue channel.
From the calculations made in the brain along those three channels, we get four basic colors: blue, green, yellow, and red. Seeing blue is what you experience when low-wavelength light excites the blue cones more than the green and red.
Seeing green happens when light excites the green cones more than the red cones. Seeing red happens when only the red cones are excited by high-wavelength light.
Here’s where it gets interesting. Seeing yellow is what happens when BOTH the green AND red cones are highly excited near their peak sensitivity. This is the biggest collective excitement that your cones ever have, aside from seeing pure white.
Notice that yellow occurs at peak intensity in the graph to the right. Further, the lens and cornea of the eye happen to block shorter wavelengths, reducing sensitivity to blue and violet light.
“Unless you have all the relevant spectral measurements, a colour rendition chart should not be used to perform colour-correction of camera imagery but only for white balancing and relative exposure adjustments.”
“Using a colour rendition chart for colour-correction might dramatically increase error if the scene light source spectrum is different from the illuminant used to compute the colour rendition chart’s reference values.”
“other factors make using a colour rendition chart unsuitable for camera calibration:
– Uncontrolled geometry of the colour rendition chart with the incident illumination and the camera.
– Unknown sample reflectances and ageing as the colour of the samples vary with time.
– Low samples count.
– Camera noise and flare.
– Etc…
“Those issues are well understood in the VFX industry, and when receiving plates, we almost exclusively use colour rendition charts to white balance and perform relative exposure adjustments, i.e. plate neutralisation.”