COMPOSITION
DESIGN
-
Tokyo Prime 1 Studio 2022 + XM Studios Boots | Batman, Movies, Anime & Games Statues and Collectibles
Read more: Tokyo Prime 1 Studio 2022 + XM Studios Boots | Batman, Movies, Anime & Games Statues and Collectiblesnearly 140 statues at the booth from licenses including DC Comics, Lord of the Rings, Uncharted, The Last of Us, Bloodborne, Demon Souls, God of War, Jurassic Park, Godzilla, Predator, Aliens, Transformers, Berserk, Evangelion, My Hero Academia, Chainsaw Man, Attack on Titan, the DC movie universe, X-Men, Spider-man and much more
COLOR
-
Brett Jones / Phil Reyneri (Lightform) / Philipp7pc: The study of Projection Mapping through Projectors
Read more: Brett Jones / Phil Reyneri (Lightform) / Philipp7pc: The study of Projection Mapping through ProjectorsVideo Projection Tool Software
https://hcgilje.wordpress.com/vpt/https://www.projectorpoint.co.uk/news/how-bright-should-my-projector-be/
http://www.adwindowscreens.com/the_calculator/
heavym
https://heavym.net/en/MadMapper
https://madmapper.com/ -
Capturing textures albedo
Read more: Capturing textures albedoBuilding a Portable PBR Texture Scanner by Stephane Lb
http://rtgfx.com/pbr-texture-scanner/How To Split Specular And Diffuse In Real Images, by John Hable
http://filmicworlds.com/blog/how-to-split-specular-and-diffuse-in-real-images/Capturing albedo using a Spectralon
https://www.activision.com/cdn/research/Real_World_Measurements_for_Call_of_Duty_Advanced_Warfare.pdfReal_World_Measurements_for_Call_of_Duty_Advanced_Warfare.pdf
Spectralon is a teflon-based pressed powderthat comes closest to being a pure Lambertian diffuse material that reflects 100% of all light. If we take an HDR photograph of the Spectralon alongside the material to be measured, we can derive thediffuse albedo of that material.
The process to capture diffuse reflectance is very similar to the one outlined by Hable.
1. We put a linear polarizing filter in front of the camera lens and a second linear polarizing filterin front of a modeling light or a flash such that the two filters are oriented perpendicular to eachother, i.e. cross polarized.
2. We place Spectralon close to and parallel with the material we are capturing and take brack-eted shots of the setup7. Typically, we’ll take nine photographs, from -4EV to +4EV in 1EVincrements.
3. We convert the bracketed shots to a linear HDR image. We found that many HDR packagesdo not produce an HDR image in which the pixel values are linear. PTGui is an example of apackage which does generate a linear HDR image. At this point, because of the cross polarization,the image is one of surface diffuse response.
4. We open the file in Photoshop and normalize the image by color picking the Spectralon, filling anew layer with that color and setting that layer to “Divide”. This sets the Spectralon to 1 in theimage. All other color values are relative to this so we can consider them as diffuse albedo.
-
The Forbidden colors – Red-Green & Blue-Yellow: The Stunning Colors You Can’t See
Read more: The Forbidden colors – Red-Green & Blue-Yellow: The Stunning Colors You Can’t Seewww.livescience.com/17948-red-green-blue-yellow-stunning-colors.html
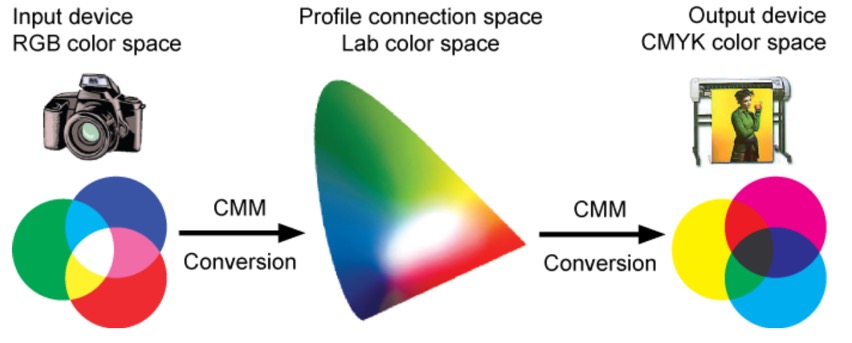
While the human eye has red, green, and blue-sensing cones, those cones are cross-wired in the retina to produce a luminance channel plus a red-green and a blue-yellow channel, and it’s data in that color space (known technically as “LAB”) that goes to the brain. That’s why we can’t perceive a reddish-green or a yellowish-blue, whereas such colors can be represented in the RGB color space used by digital cameras.
https://en.rockcontent.com/blog/the-use-of-yellow-in-data-design
The back of the retina is covered in light-sensitive neurons known as cone cells and rod cells. There are three types of cone cells, each sensitive to different ranges of light. These ranges overlap, but for convenience the cones are referred to as blue (short-wavelength), green (medium-wavelength), and red (long-wavelength). The rod cells are primarily used in low-light situations, so we’ll ignore those for now.
When light enters the eye and hits the cone cells, the cones get excited and send signals to the brain through the visual cortex. Different wavelengths of light excite different combinations of cones to varying levels, which generates our perception of color. You can see that the red cones are most sensitive to light, and the blue cones are least sensitive. The sensitivity of green and red cones overlaps for most of the visible spectrum.
Here’s how your brain takes the signals of light intensity from the cones and turns it into color information. To see red or green, your brain finds the difference between the levels of excitement in your red and green cones. This is the red-green channel.
To get “brightness,” your brain combines the excitement of your red and green cones. This creates the luminance, or black-white, channel. To see yellow or blue, your brain then finds the difference between this luminance signal and the excitement of your blue cones. This is the yellow-blue channel.
From the calculations made in the brain along those three channels, we get four basic colors: blue, green, yellow, and red. Seeing blue is what you experience when low-wavelength light excites the blue cones more than the green and red.
Seeing green happens when light excites the green cones more than the red cones. Seeing red happens when only the red cones are excited by high-wavelength light.
Here’s where it gets interesting. Seeing yellow is what happens when BOTH the green AND red cones are highly excited near their peak sensitivity. This is the biggest collective excitement that your cones ever have, aside from seeing pure white.
Notice that yellow occurs at peak intensity in the graph to the right. Further, the lens and cornea of the eye happen to block shorter wavelengths, reducing sensitivity to blue and violet light.
-
Practical Aspects of Spectral Data and LEDs in Digital Content Production and Virtual Production – SIGGRAPH 2022
Read more: Practical Aspects of Spectral Data and LEDs in Digital Content Production and Virtual Production – SIGGRAPH 2022Comparison to the commercial side
https://www.ecolorled.com/blog/detail/what-is-rgb-rgbw-rgbic-strip-lights
RGBW (RGB + White) LED strip uses a 4-in-1 LED chip made up of red, green, blue, and white.
RGBWW (RGB + White + Warm White) LED strip uses either a 5-in-1 LED chip with red, green, blue, white, and warm white for color mixing. The only difference between RGBW and RGBWW is the intensity of the white color. The term RGBCCT consists of RGB and CCT. CCT (Correlated Color Temperature) means that the color temperature of the led strip light can be adjusted to change between warm white and white. Thus, RGBWW strip light is another name of RGBCCT strip.
RGBCW is the acronym for Red, Green, Blue, Cold, and Warm. These 5-in-1 chips are used in supper bright smart LED lighting products
-
Tim Kang – calibrated white light values in sRGB color space
8bit sRGB encoded
2000K 255 139 22
2700K 255 172 89
3000K 255 184 109
3200K 255 190 122
4000K 255 211 165
4300K 255 219 178
D50 255 235 205
D55 255 243 224
D5600 255 244 227
D6000 255 249 240
D65 255 255 255
D10000 202 221 255
D20000 166 196 2558bit Rec709 Gamma 2.4
2000K 255 145 34
2700K 255 177 97
3000K 255 187 117
3200K 255 193 129
4000K 255 214 170
4300K 255 221 182
D50 255 236 208
D55 255 243 226
D5600 255 245 229
D6000 255 250 241
D65 255 255 255
D10000 204 222 255
D20000 170 199 2558bit Display P3 encoded
2000K 255 154 63
2700K 255 185 109
3000K 255 195 127
3200K 255 201 138
4000K 255 219 176
4300K 255 225 187
D50 255 239 212
D55 255 245 228
D5600 255 246 231
D6000 255 251 242
D65 255 255 255
D10000 208 223 255
D20000 175 199 25510bit Rec2020 PQ (100 nits)
2000K 520 435 273
2700K 520 466 358
3000K 520 475 384
3200K 520 480 399
4000K 520 495 446
4300K 520 500 458
D50 520 510 482
D55 520 514 497
D5600 520 514 500
D6000 520 517 509
D65 520 520 520
D10000 479 489 520
D20000 448 464 520 -
Image rendering bit depth
The terms 8-bit, 16-bit, 16-bit float, and 32-bit refer to different data formats used to store and represent image information, as bits per pixel.
https://en.wikipedia.org/wiki/Color_depth
In color technology, color depth also known as bit depth, is either the number of bits used to indicate the color of a single pixel, OR the number of bits used for each color component of a single pixel.
When referring to a pixel, the concept can be defined as bits per pixel (bpp).
When referring to a color component, the concept can be defined as bits per component, bits per channel, bits per color (all three abbreviated bpc), and also bits per pixel component, bits per color channel or bits per sample (bps). Modern standards tend to use bits per component, but historical lower-depth systems used bits per pixel more often.
Color depth is only one aspect of color representation, expressing the precision with which the amount of each primary can be expressed; the other aspect is how broad a range of colors can be expressed (the gamut). The definition of both color precision and gamut is accomplished with a color encoding specification which assigns a digital code value to a location in a color space.
Here’s a simple explanation of each.
8-bit images (i.e. 24 bits per pixel for a color image) are considered Low Dynamic Range.
They can store around 5 stops of light and each pixel carry a value from 0 (black) to 255 (white).
As a comparison, DSLR cameras can capture ~12-15 stops of light and they use RAW files to store the information.16-bit: This format is commonly referred to as “half-precision.” It uses 16 bits of data to represent color values for each pixel. With 16 bits, you can have 65,536 discrete levels of color, allowing for relatively high precision and smooth gradients. However, it has a limited dynamic range, meaning it cannot accurately represent extremely bright or dark values. It is commonly used for regular images and textures.
16-bit float: This format is an extension of the 16-bit format but uses floating-point numbers instead of fixed integers. Floating-point numbers allow for more precise calculations and a larger dynamic range. In this case, the 16 bits are used to store both the color value and the exponent, which controls the range of values that can be represented. The 16-bit float format provides better accuracy and a wider dynamic range than regular 16-bit, making it useful for high-dynamic-range imaging (HDRI) and computations that require more precision.
32-bit: (i.e. 96 bits per pixel for a color image) are considered High Dynamic Range. This format, also known as “full-precision” or “float,” uses 32 bits to represent color values and offers the highest precision and dynamic range among the three options. With 32 bits, you have a significantly larger number of discrete levels, allowing for extremely accurate color representation, smooth gradients, and a wide range of brightness values. It is commonly used for professional rendering, visual effects, and scientific applications where maximum precision is required.
Bits and HDR coverage
High Dynamic Range (HDR) images are designed to capture a wide range of luminance values, from the darkest shadows to the brightest highlights, in order to reproduce a scene with more accuracy and detail. The bit depth of an image refers to the number of bits used to represent each pixel’s color information. When comparing 32-bit float and 16-bit float HDR images, the drop in accuracy primarily relates to the precision of the color information.
A 32-bit float HDR image offers a higher level of precision compared to a 16-bit float HDR image. In a 32-bit float format, each color channel (red, green, and blue) is represented by 32 bits, allowing for a larger range of values to be stored. This increased precision enables the image to retain more details and subtleties in color and luminance.
On the other hand, a 16-bit float HDR image utilizes 16 bits per color channel, resulting in a reduced range of values that can be represented. This lower precision leads to a loss of fine details and color nuances, especially in highly contrasted areas of the image where there are significant differences in luminance.
The drop in accuracy between 32-bit and 16-bit float HDR images becomes more noticeable as the exposure range of the scene increases. Exposure range refers to the span between the darkest and brightest areas of an image. In scenes with a limited exposure range, where the luminance differences are relatively small, the loss of accuracy may not be as prominent or perceptible. These images usually are around 8-10 exposure levels.
However, in scenes with a wide exposure range, such as a landscape with deep shadows and bright highlights, the reduced precision of a 16-bit float HDR image can result in visible artifacts like color banding, posterization, and loss of detail in both shadows and highlights. The image may exhibit abrupt transitions between tones or colors, which can appear unnatural and less realistic.
To provide a rough estimate, it is often observed that exposure values beyond approximately ±6 to ±8 stops from the middle gray (18% reflectance) may be more prone to accuracy issues in a 16-bit float format. This range may vary depending on the specific implementation and encoding scheme used.
To summarize, the drop in accuracy between 32-bit and 16-bit float HDR images is mainly related to the reduced precision of color information. This decrease in precision becomes more apparent in scenes with a wide exposure range, affecting the representation of fine details and leading to visible artifacts in the image.
In practice, this means that exposure values beyond a certain range will experience a loss of accuracy and detail when stored in a 16-bit float format. The exact range at which this loss occurs depends on the encoding scheme and the specific implementation. However, in general, extremely bright or extremely dark values that fall outside the representable range may be subject to quantization errors, resulting in loss of detail, banding, or other artifacts.
HDRs used for lighting purposes are usually slightly convolved to improve on sampling speed and removing specular artefacts. To that extent, 16 bit float HDRIs tend to me most used in CG cycles.
-
VES Cinematic Color – Motion-Picture Color Management
This paper presents an introduction to the color pipelines behind modern feature-film visual-effects and animation.
Authored by Jeremy Selan, and reviewed by the members of the VES Technology Committee including Rob Bredow, Dan Candela, Nick Cannon, Paul Debevec, Ray Feeney, Andy Hendrickson, Gautham Krishnamurti, Sam Richards, Jordan Soles, and Sebastian Sylwan.
-
Rec-2020 – TVs new color gamut standard used by Dolby Vision?
https://www.hdrsoft.com/resources/dri.html#bit-depth
The dynamic range is a ratio between the maximum and minimum values of a physical measurement. Its definition depends on what the dynamic range refers to.
For a scene: Dynamic range is the ratio between the brightest and darkest parts of the scene.
For a camera: Dynamic range is the ratio of saturation to noise. More specifically, the ratio of the intensity that just saturates the camera to the intensity that just lifts the camera response one standard deviation above camera noise.
For a display: Dynamic range is the ratio between the maximum and minimum intensities emitted from the screen.
The Dynamic Range of real-world scenes can be quite high — ratios of 100,000:1 are common in the natural world. An HDR (High Dynamic Range) image stores pixel values that span the whole tonal range of real-world scenes. Therefore, an HDR image is encoded in a format that allows the largest range of values, e.g. floating-point values stored with 32 bits per color channel. Another characteristics of an HDR image is that it stores linear values. This means that the value of a pixel from an HDR image is proportional to the amount of light measured by the camera.
For TVs HDR is great, but it’s not the only new TV feature worth discussing.
Wide color gamut, or WCG, is often lumped in with HDR. While they’re often found together, they’re not intrinsically linked. Where HDR is an increase in the dynamic range of the picture (with contrast and brighter highlights in particular), a TV’s wide color gamut coverage refers to how much of the new, larger color gamuts a TV can display.
Wide color gamuts only really matter for HDR video sources like UHD Blu-rays and some streaming video, as only HDR sources are meant to take advantage of the ability to display more colors.
www.cnet.com/how-to/what-is-wide-color-gamut-wcg/
Color depth is only one aspect of color representation, expressing the precision with which the amount of each primary can be expressed through a pixel; the other aspect is how broad a range of colors can be expressed (the gamut)
Image rendering bit depth
Wide color gamuts include a greater number of colors than what most current TVs can display, so the greater a TV’s coverage of a wide color gamut, the more colors a TV will be able to reproduce.
When we talk about a color space or color gamut we refer to the range of color values stored in an image. The perception of these color also requires a display that has been tuned with to resolve these color profiles at best. This is often referred to as a ‘viewer lut’.
So this comes also usually paired with an increase in bit depth, going from the old 8 bit system (256 shades per color, with the potential of over 16.7 million colors: 256 green x 256 blue x 256 red) to 10 (1024+ shades per color, with access to over a billion colors) or higher bits, like 12 bit (4096 shades per RGB for 68 billion colors).
The advantage of higher bit depth is in the ability to bias color with the minimum loss.
For an extreme example, raising the brightness from a completely dark image allows for better reproduction, independently on the reproduction medium, due to the amount of data available at editing time:
For reference, 8-bit images (i.e. 24 bits per pixel for a color image) are considered Low Dynamic Range.
They can store around 5 stops of light and each pixel carry a value from 0 (black) to 255 (white).
As a comparison, DSLR cameras can capture ~12-15 stops of light and they use RAW files to store the information.https://www.cambridgeincolour.com/tutorials/dynamic-range.htm
https://www.hdrsoft.com/resources/dri.html#bit-depth
Note that the number of bits itself may be a misleading indication of the real dynamic range that the image reproduces — converting a Low Dynamic Range image to a higher bit depth does not change its dynamic range, of course.
- 8-bit images (i.e. 24 bits per pixel for a color image) are considered Low Dynamic Range.
- 16-bit images (i.e. 48 bits per pixel for a color image) resulting from RAW conversion are still considered Low Dynamic Range, even though the range of values they can encode is significantly higher than for 8-bit images (65536 versus 256). Note that converting a RAW file involves applying a tonal curve that compresses the dynamic range of the RAW data so that the converted image shows correctly on low dynamic range monitors. The need to adapt the output image file to the dynamic range of the display is the factor that dictates how much the dynamic range is compressed, not the output bit-depth. By using 16 instead of 8 bits, you will gain precision but you will not gain dynamic range.
- 32-bit images (i.e. 96 bits per pixel for a color image) are considered High Dynamic Range.Unlike 8- and 16-bit images which can take a finite number of values, 32-bit images are coded using floating point numbers, which means the values they can take is unlimited.It is important to note, though, that storing an image in a 32-bit HDR format is a necessary condition for an HDR image but not a sufficient one. When an image comes from a single capture with a standard camera, it will remain a Low Dynamic Range image,
Also note that bit depth and dynamic range are often confused as one, but are indeed separate concepts and there is no direct one to one relationship between them. Bit depth is about capacity, dynamic range is about the actual ratio of data stored.
The bit depth of a capturing or displaying device gives you an indication of its dynamic range capacity. That is, the highest dynamic range that the device would be capable of reproducing if all other constraints are eliminated.https://rawpedia.rawtherapee.com/Bit_Depth
Finally, note that there are two ways to “count” bits for an image — either the number of bits per color channel (BPC) or the number of bits per pixel (BPP). A bit (0,1) is the smallest unit of data stored in a computer.
For a grayscale image, 8-bit means that each pixel can be one of 256 levels of gray (256 is 2 to the power 8).
For an RGB color image, 8-bit means that each one of the three color channels can be one of 256 levels of color.
Since each pixel is represented by 3 colors in this case, 8-bit per color channel actually means 24-bit per pixel.Similarly, 16-bit for an RGB image means 65,536 levels per color channel and 48-bit per pixel.
To complicate matters, when an image is classified as 16-bit, it just means that it can store a maximum 65,535 values. It does not necessarily mean that it actually spans that range. If the camera sensors can not capture more than 12 bits of tonal values, the actual bit depth of the image will be at best 12-bit and probably less because of noise.
The following table attempts to summarize the above for the case of an RGB color image.
Type of digital support Bit depth per color channel Bit depth per pixel FStops Theoretical maximum Dynamic Range Reality 8-bit 8 24 8 256:1 most consumer images 12-bit CCD 12 36 12 4,096:1 real maximum limited by noise 14-bit CCD 14 42 14 16,384:1 real maximum limited by noise 16-bit TIFF (integer) 16 48 16 65,536:1 bit-depth in this case is not directly related to the dynamic range captured 16-bit float EXR 16 48 30 65,536:1 values are distributed more closely in the (lower) darker tones than in the (higher) lighter ones, thus allowing for a more accurate description of the tones more significant to humans. The range of normalized 16-bit floats can represent thirty stops of information with 1024 steps per stop. We have eighteen and a half stops over middle gray, and eleven and a half below. The denormalized numbers provide an additional ten stops with decreasing precision per stop.
http://download.nvidia.com/developer/GPU_Gems/CD_Image/Image_Processing/OpenEXR/OpenEXR-1.0.6/doc/#recsHDR image (e.g. Radiance format) 32 96 “infinite” 4.3 billion:1 real maximum limited by the captured dynamic range 32-bit floats are often called “single-precision” floats, and 64-bit floats are often called “double-precision” floats. 16-bit floats therefore are called “half-precision” floats, or just “half floats”.
https://petapixel.com/2018/09/19/8-12-14-vs-16-bit-depth-what-do-you-really-need
On a separate note, even Photoshop does not handle 16bit per channel. Photoshop does actually use 16-bits per channel. However, it treats the 16th digit differently – it is simply added to the value created from the first 15-digits. This is sometimes called 15+1 bits. This means that instead of 216 possible values (which would be 65,536 possible values) there are only 215+1 possible values (which is 32,768 +1 = 32,769 possible values).
Rec-601 (for the older SDTV format, very similar to rec-709) and Rec-709 (the HDTV’s recommended set of color standards, at times also referred to sRGB, although not exactly the same) are currently the most spread color formats and hardware configurations in the world.
Following those you can find the larger P3 gamut, more commonly used in theaters and in digital production houses (with small variations and improvements to color coverage), as well as most of best 4K/WCG TVs.
And a new standard is now promoted against P3, referred to Rec-2020 and UHDTV.
It is still debatable if this is going to be adopted at consumer level beyond the P3, mainly due to lack of hardware supporting it. But initial tests do prove that it would be a future proof investment.
www.colour-science.org/anders-langlands/
Rec. 2020 is ultimately designed for television, and not cinema. Therefore, it is to be expected that its properties must behave according to current signal processing standards. In this respect, its foundation is based on current HD and SD video signal characteristics.
As far as color bit depth is concerned, it allows for a maximum of 12 bits, which is more than enough for humans.
Comparing standards, REC-709 covers 35.9% of the human visible spectrum. P3 45.5%. And REC-2020 75.8%.
https://www.avsforum.com/forum/166-lcd-flat-panel-displays/2812161-what-color-volume.htmlComparing coverage to hardware devices
To note that all the new standards generally score very high on the Pointer’s Gamut chart. But with REC-2020 scoring 99.9% vs P3 at 88.2%.
www.tftcentral.co.uk/articles/pointers_gamut.htmhttps://www.slideshare.net/hpduiker/acescg-a-common-color-encoding-for-visual-effects-applications
The Pointer’s gamut is (an approximation of) the gamut of real surface colors as can be seen by the human eye, based on the research by Michael R. Pointer (1980). What this means is that every color that can be reflected by the surface of an object of any material is inside the Pointer’s gamut. Basically establishing a widely respected target for color reproduction. Visually, Pointers Gamut represents the colors we see about us in the natural world. Colors outside Pointers Gamut include those that do not occur naturally, such as neon lights and computer-generated colors possible in animation. Which would partially be accounted for with the new gamuts.
cinepedia.com/picture/color-gamut/
Not all current TVs can support the full spread of the new gamuts. Here is a list of modern TVs’ color coverage in percentage:
www.rtings.com/tv/tests/picture-quality/wide-color-gamut-rec-709-dci-p3-rec-2020There are no TVs that can come close to displaying all the colors within Rec.2020, and there likely won’t be for at least a few years. However, to help future-proof the technology, Rec.2020 support is already baked into the HDR spec. That means that the same genuine HDR media that fills the DCI P3 space on a compatible TV now, will in a few years also fill Rec.2020 on a TV supporting that larger space.
Rec.2020’s main gains are in the number of new tones of green that it will display, though it also offers improvements to the number of blue and red colors as well. Altogether, Rec.2020 will cover about 75% of the visual spectrum, which is a sizeable increase in coverage even over DCI P3.
Dolby Vision
https://www.highdefdigest.com/news/show/what-is-dolby-vision/39049
https://www.techhive.com/article/3237232/dolby-vision-vs-hdr10-which-is-best.html
Dolby Vision is a proprietary end-to-end High Dynamic Range (HDR) format that covers content creation and playback through select cinemas, Ultra HD displays, and 4K titles. Like other HDR standards, the process uses expanded brightness to improve contrast between dark and light aspects of an image, bringing out deeper black levels and more realistic details in specular highlights — like the sun reflecting off of an ocean — in specially graded Dolby Vision material.
The iPhone 12 Pro gets the ability to record 4K 10-bit HDR video. According to Apple, it is the very first smartphone that is capable of capturing Dolby Vision HDR.
The iPhone 12 Pro takes two separate exposures and runs them through Apple’s custom image signal processor to create a histogram, which is a graph of the tonal values in each frame. The Dolby Vision metadata is then generated based on that histogram. In Laymen’s terms, it is essentially doing real-time grading while you are shooting. This is only possible due to the A14 Bionic chip.
Dolby Vision also allows for 12-bit color, as opposed to HDR10’s and HDR10+’s 10-bit color. While no retail TV we’re aware of supports 12-bit color, Dolby claims it can be down-sampled in such a way as to render 10-bit color more accurately.
Resources for more reading:
https://www.avsforum.com/forum/166-lcd-flat-panel-displays/2812161-what-color-volume.html
wolfcrow.com/say-hello-to-rec-2020-the-color-space-of-the-future/
www.cnet.com/news/ultra-hd-tv-color-part-ii-the-future/
-
Björn Ottosson – How software gets color wrong
Read more: Björn Ottosson – How software gets color wronghttps://bottosson.github.io/posts/colorwrong/
Most software around us today are decent at accurately displaying colors. Processing of colors is another story unfortunately, and is often done badly.
To understand what the problem is, let’s start with an example of three ways of blending green and magenta:
- Perceptual blend – A smooth transition using a model designed to mimic human perception of color. The blending is done so that the perceived brightness and color varies smoothly and evenly.
- Linear blend – A model for blending color based on how light behaves physically. This type of blending can occur in many ways naturally, for example when colors are blended together by focus blur in a camera or when viewing a pattern of two colors at a distance.
- sRGB blend – This is how colors would normally be blended in computer software, using sRGB to represent the colors.
Let’s look at some more examples of blending of colors, to see how these problems surface more practically. The examples use strong colors since then the differences are more pronounced. This is using the same three ways of blending colors as the first example.
Instead of making it as easy as possible to work with color, most software make it unnecessarily hard, by doing image processing with representations not designed for it. Approximating the physical behavior of light with linear RGB models is one easy thing to do, but more work is needed to create image representations tailored for image processing and human perception.
Also see:
LIGHTING
-
Is a MacBeth Colour Rendition Chart the Safest Way to Calibrate a Camera?
Read more: Is a MacBeth Colour Rendition Chart the Safest Way to Calibrate a Camera?www.colour-science.org/posts/the-colorchecker-considered-mostly-harmless/
“Unless you have all the relevant spectral measurements, a colour rendition chart should not be used to perform colour-correction of camera imagery but only for white balancing and relative exposure adjustments.”
“Using a colour rendition chart for colour-correction might dramatically increase error if the scene light source spectrum is different from the illuminant used to compute the colour rendition chart’s reference values.”
“other factors make using a colour rendition chart unsuitable for camera calibration:
– Uncontrolled geometry of the colour rendition chart with the incident illumination and the camera.
– Unknown sample reflectances and ageing as the colour of the samples vary with time.
– Low samples count.
– Camera noise and flare.
– Etc…“Those issues are well understood in the VFX industry, and when receiving plates, we almost exclusively use colour rendition charts to white balance and perform relative exposure adjustments, i.e. plate neutralisation.”
-
Photography basics: How Exposure Stops (Aperture, Shutter Speed, and ISO) Affect Your Photos – cheat sheet cards
Also see:
https://www.pixelsham.com/2018/11/22/exposure-value-measurements/
https://www.pixelsham.com/2016/03/03/f-stop-vs-t-stop/
An exposure stop is a unit measurement of Exposure as such it provides a universal linear scale to measure the increase and decrease in light, exposed to the image sensor, due to changes in shutter speed, iso and f-stop.
+-1 stop is a doubling or halving of the amount of light let in when taking a photo
1 EV (exposure value) is just another way to say one stop of exposure change.
https://www.photographymad.com/pages/view/what-is-a-stop-of-exposure-in-photography
Same applies to shutter speed, iso and aperture.
Doubling or halving your shutter speed produces an increase or decrease of 1 stop of exposure.
Doubling or halving your iso speed produces an increase or decrease of 1 stop of exposure.Because of the way f-stop numbers are calculated (ratio of focal length/lens diameter, where focal length is the distance between the lens and the sensor), an f-stop doesn’t relate to a doubling or halving of the value, but to the doubling/halving of the area coverage of a lens in relation to its focal length. And as such, to a multiplying or dividing by 1.41 (the square root of 2). For example, going from f/2.8 to f/4 is a decrease of 1 stop because 4 = 2.8 * 1.41. Changing from f/16 to f/11 is an increase of 1 stop because 11 = 16 / 1.41.
A wider aperture means that light proceeding from the foreground, subject, and background is entering at more oblique angles than the light entering less obliquely.
Consider that absolutely everything is bathed in light, therefore light bouncing off of anything is effectively omnidirectional. Your camera happens to be picking up a tiny portion of the light that’s bouncing off into infinity.
Now consider that the wider your iris/aperture, the more of that omnidirectional light you’re picking up:
When you have a very narrow iris you are eliminating a lot of oblique light. Whatever light enters, from whatever distance, enters moderately parallel as a whole. When you have a wide aperture, much more light is entering at a multitude of angles. Your lens can only focus the light from one depth – the foreground/background appear blurred because it cannot be focused on.
https://frankwhitephotography.com/index.php?id=28:what-is-a-stop-in-photography
The great thing about stops is that they give us a way to directly compare shutter speed, aperture diameter, and ISO speed. This means that we can easily swap these three components about while keeping the overall exposure the same.
http://lifehacker.com/how-aperture-shutter-speed-and-iso-affect-pictures-sh-1699204484
https://www.techradar.com/how-to/the-exposure-triangle
https://www.videoschoolonline.com/what-is-an-exposure-stop
Note. All three of these measurements (aperture, shutter, iso) have full stops, half stops and third stops, but if you look at the numbers they aren’t always consistent. For example, a one third stop between ISO100 and ISO 200 would be ISO133, yet most cameras are marked at ISO125.
Third-stops are especially important as they’re the increment that most cameras use for their settings. These are just imaginary divisions in each stop.
From a practical standpoint manufacturers only standardize the full stops, meaning that while they try and stay somewhat consistent there is some rounding up going on between the smaller numbers.Note that ND Filters directly modify the exposure triangle.
-
RawTherapee – a free, open source, cross-platform raw image and HDRi processing program
5.10 of this tool includes excellent tools to clean up cr2 and cr3 used on set to support HDRI processing.
Converting raw to AcesCG 32 bit tiffs with metadata. -
What is the Light Field?
Read more: What is the Light Field?http://lightfield-forum.com/what-is-the-lightfield/
The light field consists of the total of all light rays in 3D space, flowing through every point and in every direction.
How to Record a Light Field
- a single, robotically controlled camera
- a rotating arc of cameras
- an array of cameras or camera modules
- a single camera or camera lens fitted with a microlens array
-
HDRI Median Cut plugin
www.hdrlabs.com/picturenaut/plugins.html
Note. The Median Cut algorithm is typically used for color quantization, which involves reducing the number of colors in an image while preserving its visual quality. It doesn’t directly provide a way to identify the brightest areas in an image. However, if you’re interested in identifying the brightest areas, you might want to look into other methods like thresholding, histogram analysis, or edge detection, through openCV for example.
Here is an openCV example:
# bottom left coordinates = 0,0 import numpy as np import cv2 # Load the HDR or EXR image image = cv2.imread('your_image_path.exr', cv2.IMREAD_UNCHANGED) # Load as-is without modification # Calculate the luminance from the HDR channels (assuming RGB format) luminance = np.dot(image[..., :3], [0.299, 0.587, 0.114]) # Set a threshold value based on estimated EV threshold_value = 2.4 # Estimated threshold value based on 4.8 EV # Apply the threshold to identify bright areas # The
luminance
array contains the calculated luminance values for each pixel in the image. # Thethreshold_value
is a user-defined value that represents a cutoff point, separating "bright" and "dark" areas in terms of perceived luminance.thresholded = (luminance > threshold_value) * 255 # Convert the thresholded image to uint8 for contour detection thresholded = thresholded.astype(np.uint8) # Find contours of the bright areas contours, _ = cv2.findContours(thresholded, cv2.RETR_EXTERNAL, cv2.CHAIN_APPROX_SIMPLE) # Create a list to store the bounding boxes of bright areas bright_areas = [] # Iterate through contours and extract bounding boxes for contour in contours: x, y, w, h = cv2.boundingRect(contour) # Adjust y-coordinate based on bottom-left origin y_bottom_left_origin = image.shape[0] - (y + h) bright_areas.append((x, y_bottom_left_origin, x + w, y_bottom_left_origin + h)) # Store as (x1, y1, x2, y2) # Print the identified bright areas print("Bright Areas (x1, y1, x2, y2):") for area in bright_areas: print(area)
More details
Luminance and Exposure in an EXR Image:
- An EXR (Extended Dynamic Range) image format is often used to store high dynamic range (HDR) images that contain a wide range of luminance values, capturing both dark and bright areas.
- Luminance refers to the perceived brightness of a pixel in an image. In an RGB image, luminance is often calculated using a weighted sum of the red, green, and blue channels, where different weights are assigned to each channel to account for human perception.
- In an EXR image, the pixel values can represent radiometrically accurate scene values, including actual radiance or irradiance levels. These values are directly related to the amount of light emitted or reflected by objects in the scene.
The luminance line is calculating the luminance of each pixel in the image using a weighted sum of the red, green, and blue channels. The three float values [0.299, 0.587, 0.114] are the weights used to perform this calculation.
These weights are based on the concept of luminosity, which aims to approximate the perceived brightness of a color by taking into account the human eye’s sensitivity to different colors. The values are often derived from the NTSC (National Television System Committee) standard, which is used in various color image processing operations.
Here’s the breakdown of the float values:
- 0.299: Weight for the red channel.
- 0.587: Weight for the green channel.
- 0.114: Weight for the blue channel.
The weighted sum of these channels helps create a grayscale image where the pixel values represent the perceived brightness. This technique is often used when converting a color image to grayscale or when calculating luminance for certain operations, as it takes into account the human eye’s sensitivity to different colors.
For the threshold, remember that the exact relationship between EV values and pixel values can depend on the tone-mapping or normalization applied to the HDR image, as well as the dynamic range of the image itself.
To establish a relationship between exposure and the threshold value, you can consider the relationship between linear and logarithmic scales:
- Linear and Logarithmic Scales:
- Exposure values in an EXR image are often represented in logarithmic scales, such as EV (exposure value). Each increment in EV represents a doubling or halving of the amount of light captured.
- Threshold values for luminance thresholding are usually linear, representing an actual luminance level.
- Conversion Between Scales:
- To establish a mathematical relationship, you need to convert between the logarithmic exposure scale and the linear threshold scale.
- One common method is to use a power function. For instance, you can use a power function to convert EV to a linear intensity value.
threshold_value = base_value * (2 ** EV)
Here,
EV
is the exposure value,base_value
is a scaling factor that determines the relationship between EV and threshold_value, and2 ** EV
is used to convert the logarithmic EV to a linear intensity value. - Choosing the Base Value:
- The
base_value
factor should be determined based on the dynamic range of your EXR image and the specific luminance values you are dealing with. - You may need to experiment with different values of
base_value
to achieve the desired separation of bright areas from the rest of the image.
- The
Let’s say you have an EXR image with a dynamic range of 12 EV, which is a common range for many high dynamic range images. In this case, you want to set a threshold value that corresponds to a certain number of EV above the middle gray level (which is often considered to be around 0.18).
Here’s an example of how you might determine a
base_value
to achieve this:# Define the dynamic range of the image in EV dynamic_range = 12 # Choose the desired number of EV above middle gray for thresholding desired_ev_above_middle_gray = 2 # Calculate the threshold value based on the desired EV above middle gray threshold_value = 0.18 * (2 ** (desired_ev_above_middle_gray / dynamic_range)) print("Threshold Value:", threshold_value)
-
About green screens
Read more: About green screenshackaday.com/2015/02/07/how-green-screen-worked-before-computers/
www.newtek.com/blog/tips/best-green-screen-materials/
www.chromawall.com/blog//chroma-key-green
Chroma Key Green, the color of green screens is also known as Chroma Green and is valued at approximately 354C in the Pantone color matching system (PMS).
Chroma Green can be broken down in many different ways. Here is green screen green as other values useful for both physical and digital production:
Green Screen as RGB Color Value: 0, 177, 64
Green Screen as CMYK Color Value: 81, 0, 92, 0
Green Screen as Hex Color Value: #00b140
Green Screen as Websafe Color Value: #009933Chroma Key Green is reasonably close to an 18% gray reflectance.
Illuminate your green screen with an uniform source with less than 2/3 EV variation.
The level of brightness at any given f-stop should be equivalent to a 90% white card under the same lighting.
COLLECTIONS
| Featured AI
| Design And Composition
| Explore posts
POPULAR SEARCHES
unreal | pipeline | virtual production | free | learn | photoshop | 360 | macro | google | nvidia | resolution | open source | hdri | real-time | photography basics | nuke
FEATURED POSTS
Social Links
DISCLAIMER – Links and images on this website may be protected by the respective owners’ copyright. All data submitted by users through this site shall be treated as freely available to share.