Visual analogies charts, graphs and diagrams by Anna Vital
blog.adioma.com/how-to-think-visually-using-visual-analogies-infographic/#_=_
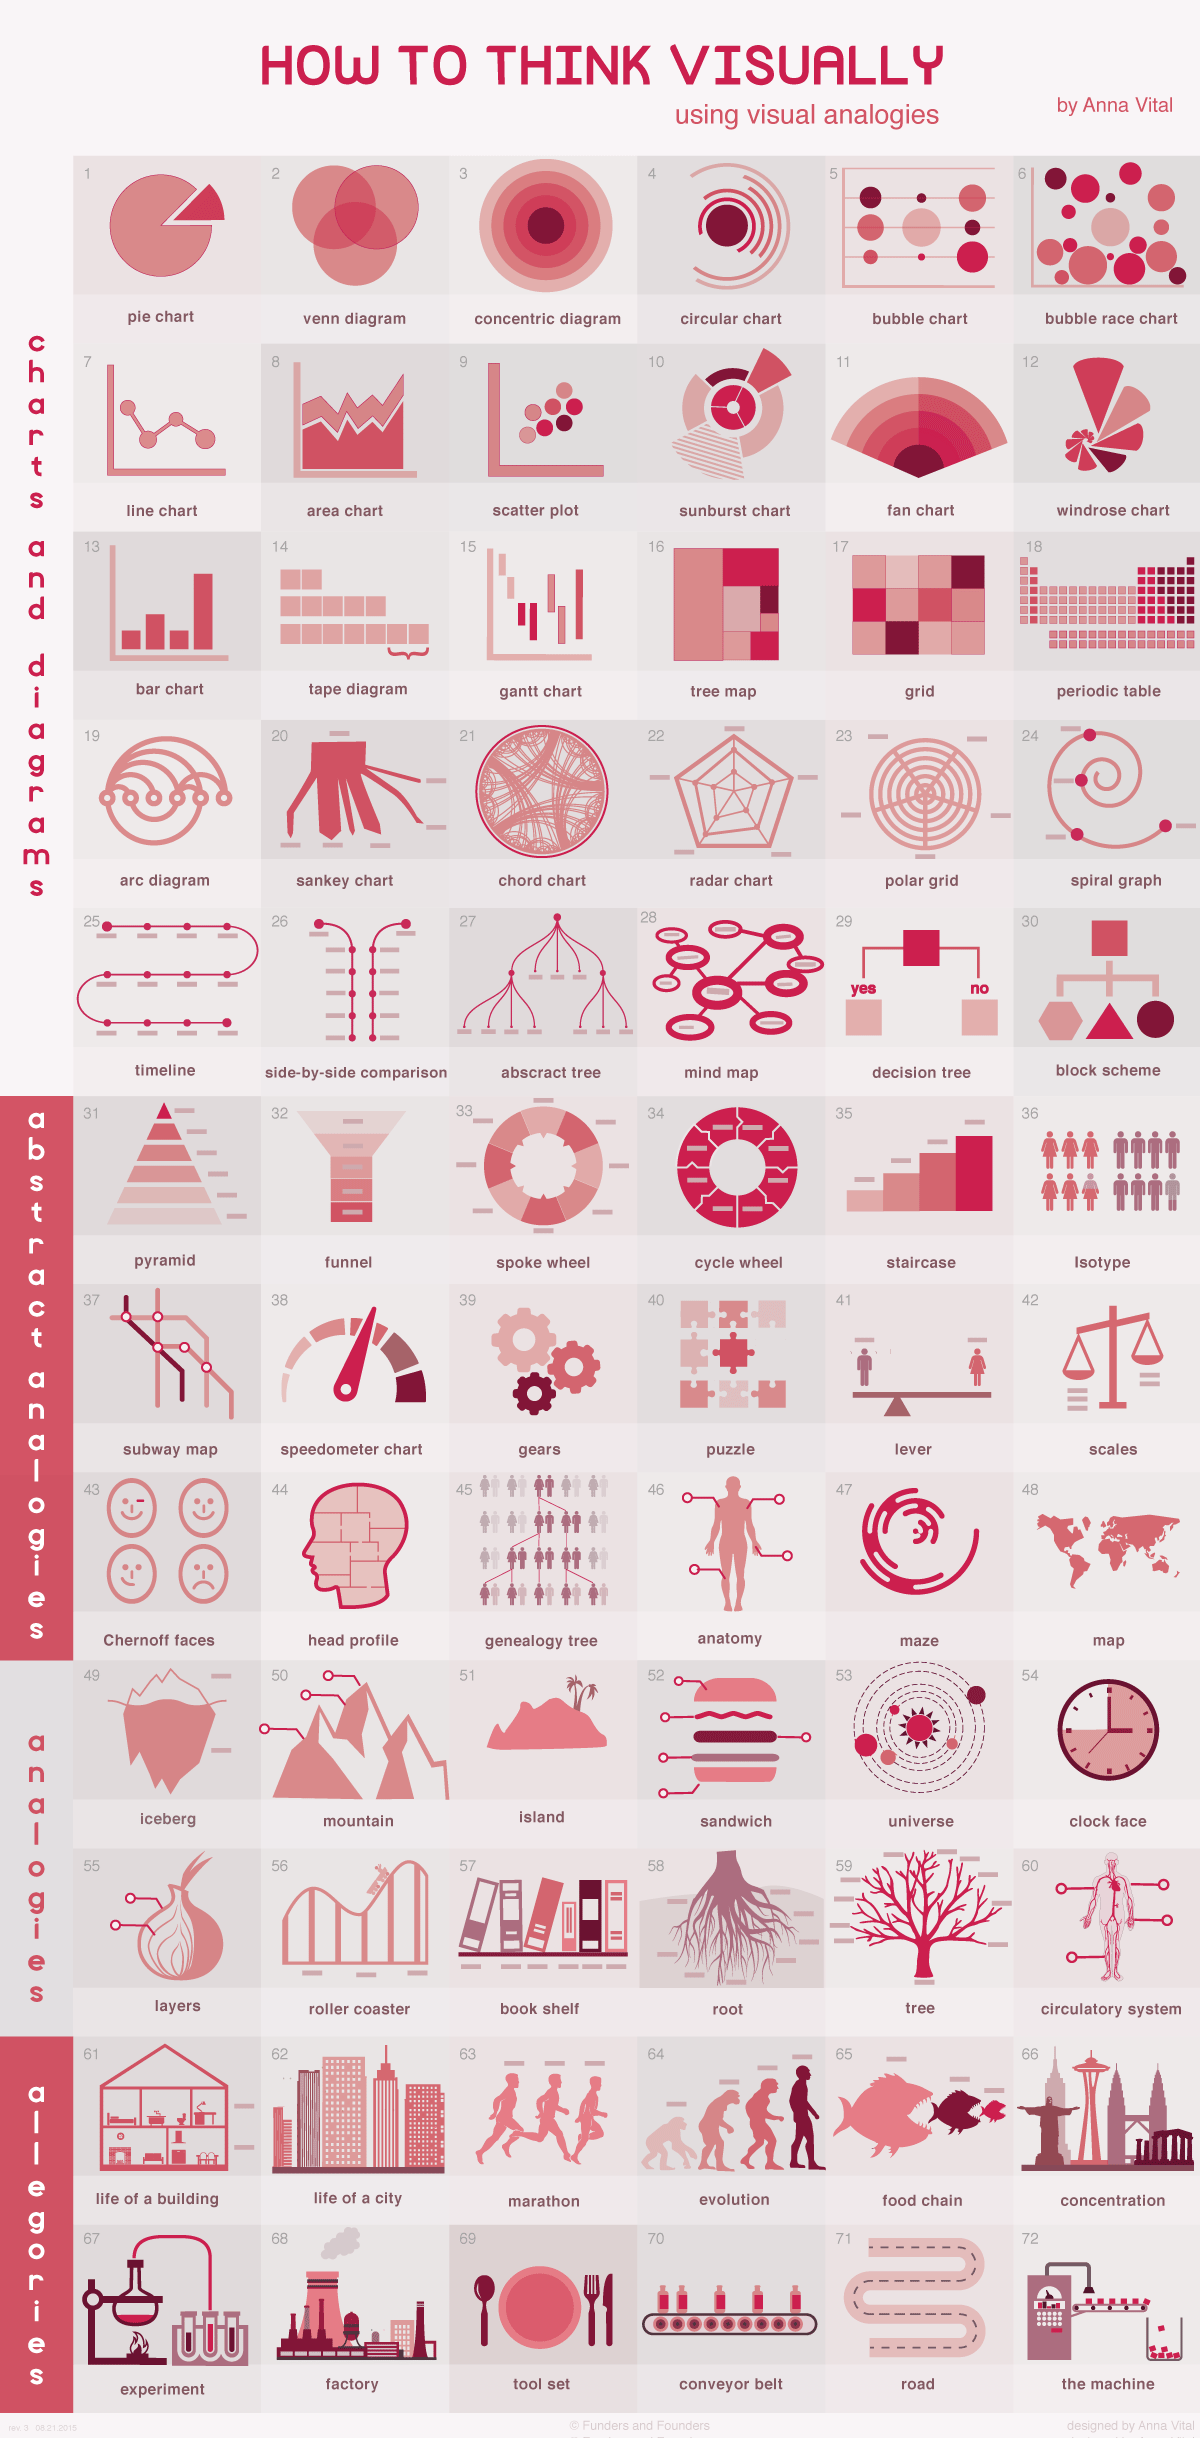
How to find the best visual analogy?
Follow there 5 principles:
1. It looks familiar to most of people
2. It has a structure
3. It matches your narrative’s structure
4. It is visible (something that can be seen)
5. It is visual (something that is easy to see)


HDR and Color
https://www.soundandvision.com/content/nits-and-bits-hdr-and-color
In HD we often refer to the range of available colors as a color gamut. Such a color gamut is typically plotted on a two-dimensional diagram, called a CIE chart, as shown in at the top of this blog. Each color is characterized by its x/y coordinates.

Good enough for government work, perhaps. But for HDR, with its higher luminance levels and wider color, the gamut becomes three-dimensional.

For HDR the color gamut therefore becomes a characteristic we now call the color volume. It isn’t easy to show color volume on a two-dimensional medium like the printed page or a computer screen, but one method is shown below. As the luminance becomes higher, the picture eventually turns to white. As it becomes darker, it fades to black. The traditional color gamut shown on the CIE chart is simply a slice through this color volume at a selected luminance level, such as 50%.
Three different color volumes—we still refer to them as color gamuts though their third dimension is important—are currently the most significant. The first is BT.709 (sometimes referred to as Rec.709), the color gamut used for pre-UHD/HDR formats, including standard HD.
The largest is known as BT.2020; it encompasses (roughly) the range of colors visible to the human eye (though ET might find it insufficient!).
Between these two is the color gamut used in digital cinema, known as DCI-P3.

sRGB

D65


How the slow down in the Chinese economy will affect housing as much as high tech
edition.cnn.com/2019/01/03/perspectives/apple-china-warning/index.html
China’s economic vulnerability is based on its very unbalanced growth model. In other advanced economies such as the United States, spending by consumers contributes as much as two-thirds or more of overall GDP. In China, consumption has risen from 35% 10 years ago, but it is still not near 60% of GDP, indicating an unbalanced economy that places emphasis on exports and investment, both of which, in the long run, are not sustainable.
Investment in infrastructure and heavy construction (around the world) turbo-boosted China’s economy in 2008 and for the next five years, but it issued a tremendous amount of debt to support such growth. Currently, the debt-to-GDP ratio for China stands at an alarming 250% of GDP, an unsustainable number and one that presents formidable challenge to China’s economic policymakers.
In the months ahead, be prepared to witness continued deterioration of the Chinese economy. This will be reflected in declining asset values such as real estate and equity markets, distressed corporate balance sheets and corporate assets, increased capital flight as a result of a declining Yuan relative to the US dollar, and growing stress within China’s financial sector as non-performing loans accelerate within the banking sector.